Monitoring Tools
Grafana
What is Grafana?
AI Platform's Grafana monitoring setup provides observability into various aspects of its Kubernetes-based infrastructure and testing environment. By leveraging Grafana’s visualization and analysis capabilities, we can monitor service health, workload performance, K6 load tests, and container logs. This helps us ensure system stability, improve performance, and troubleshoot issues effectively.
Each Grafana dashboard serves as a specific entry point for monitoring and troubleshooting within the Kubernetes ecosystem. Users can select time ranges down into metrics to gain deeper insights into system performance. Regular checks on these dashboards are recommended to ensure that all services and workloads are running optimally.
Accessing Grafana
For each AKS cluster, a separate Grafana instance is deployed. It is accessible through the /grafana endpoint specific to each cluster, formatted as https://<CLUSTER_ADDRESS>/grafana. For example, https://balder.dev.equinor.com/grafana.
As an AI Platform user, you can log in to Grafana's dashboards using single sign-on (SSO) with your Equinor Azure AD account.
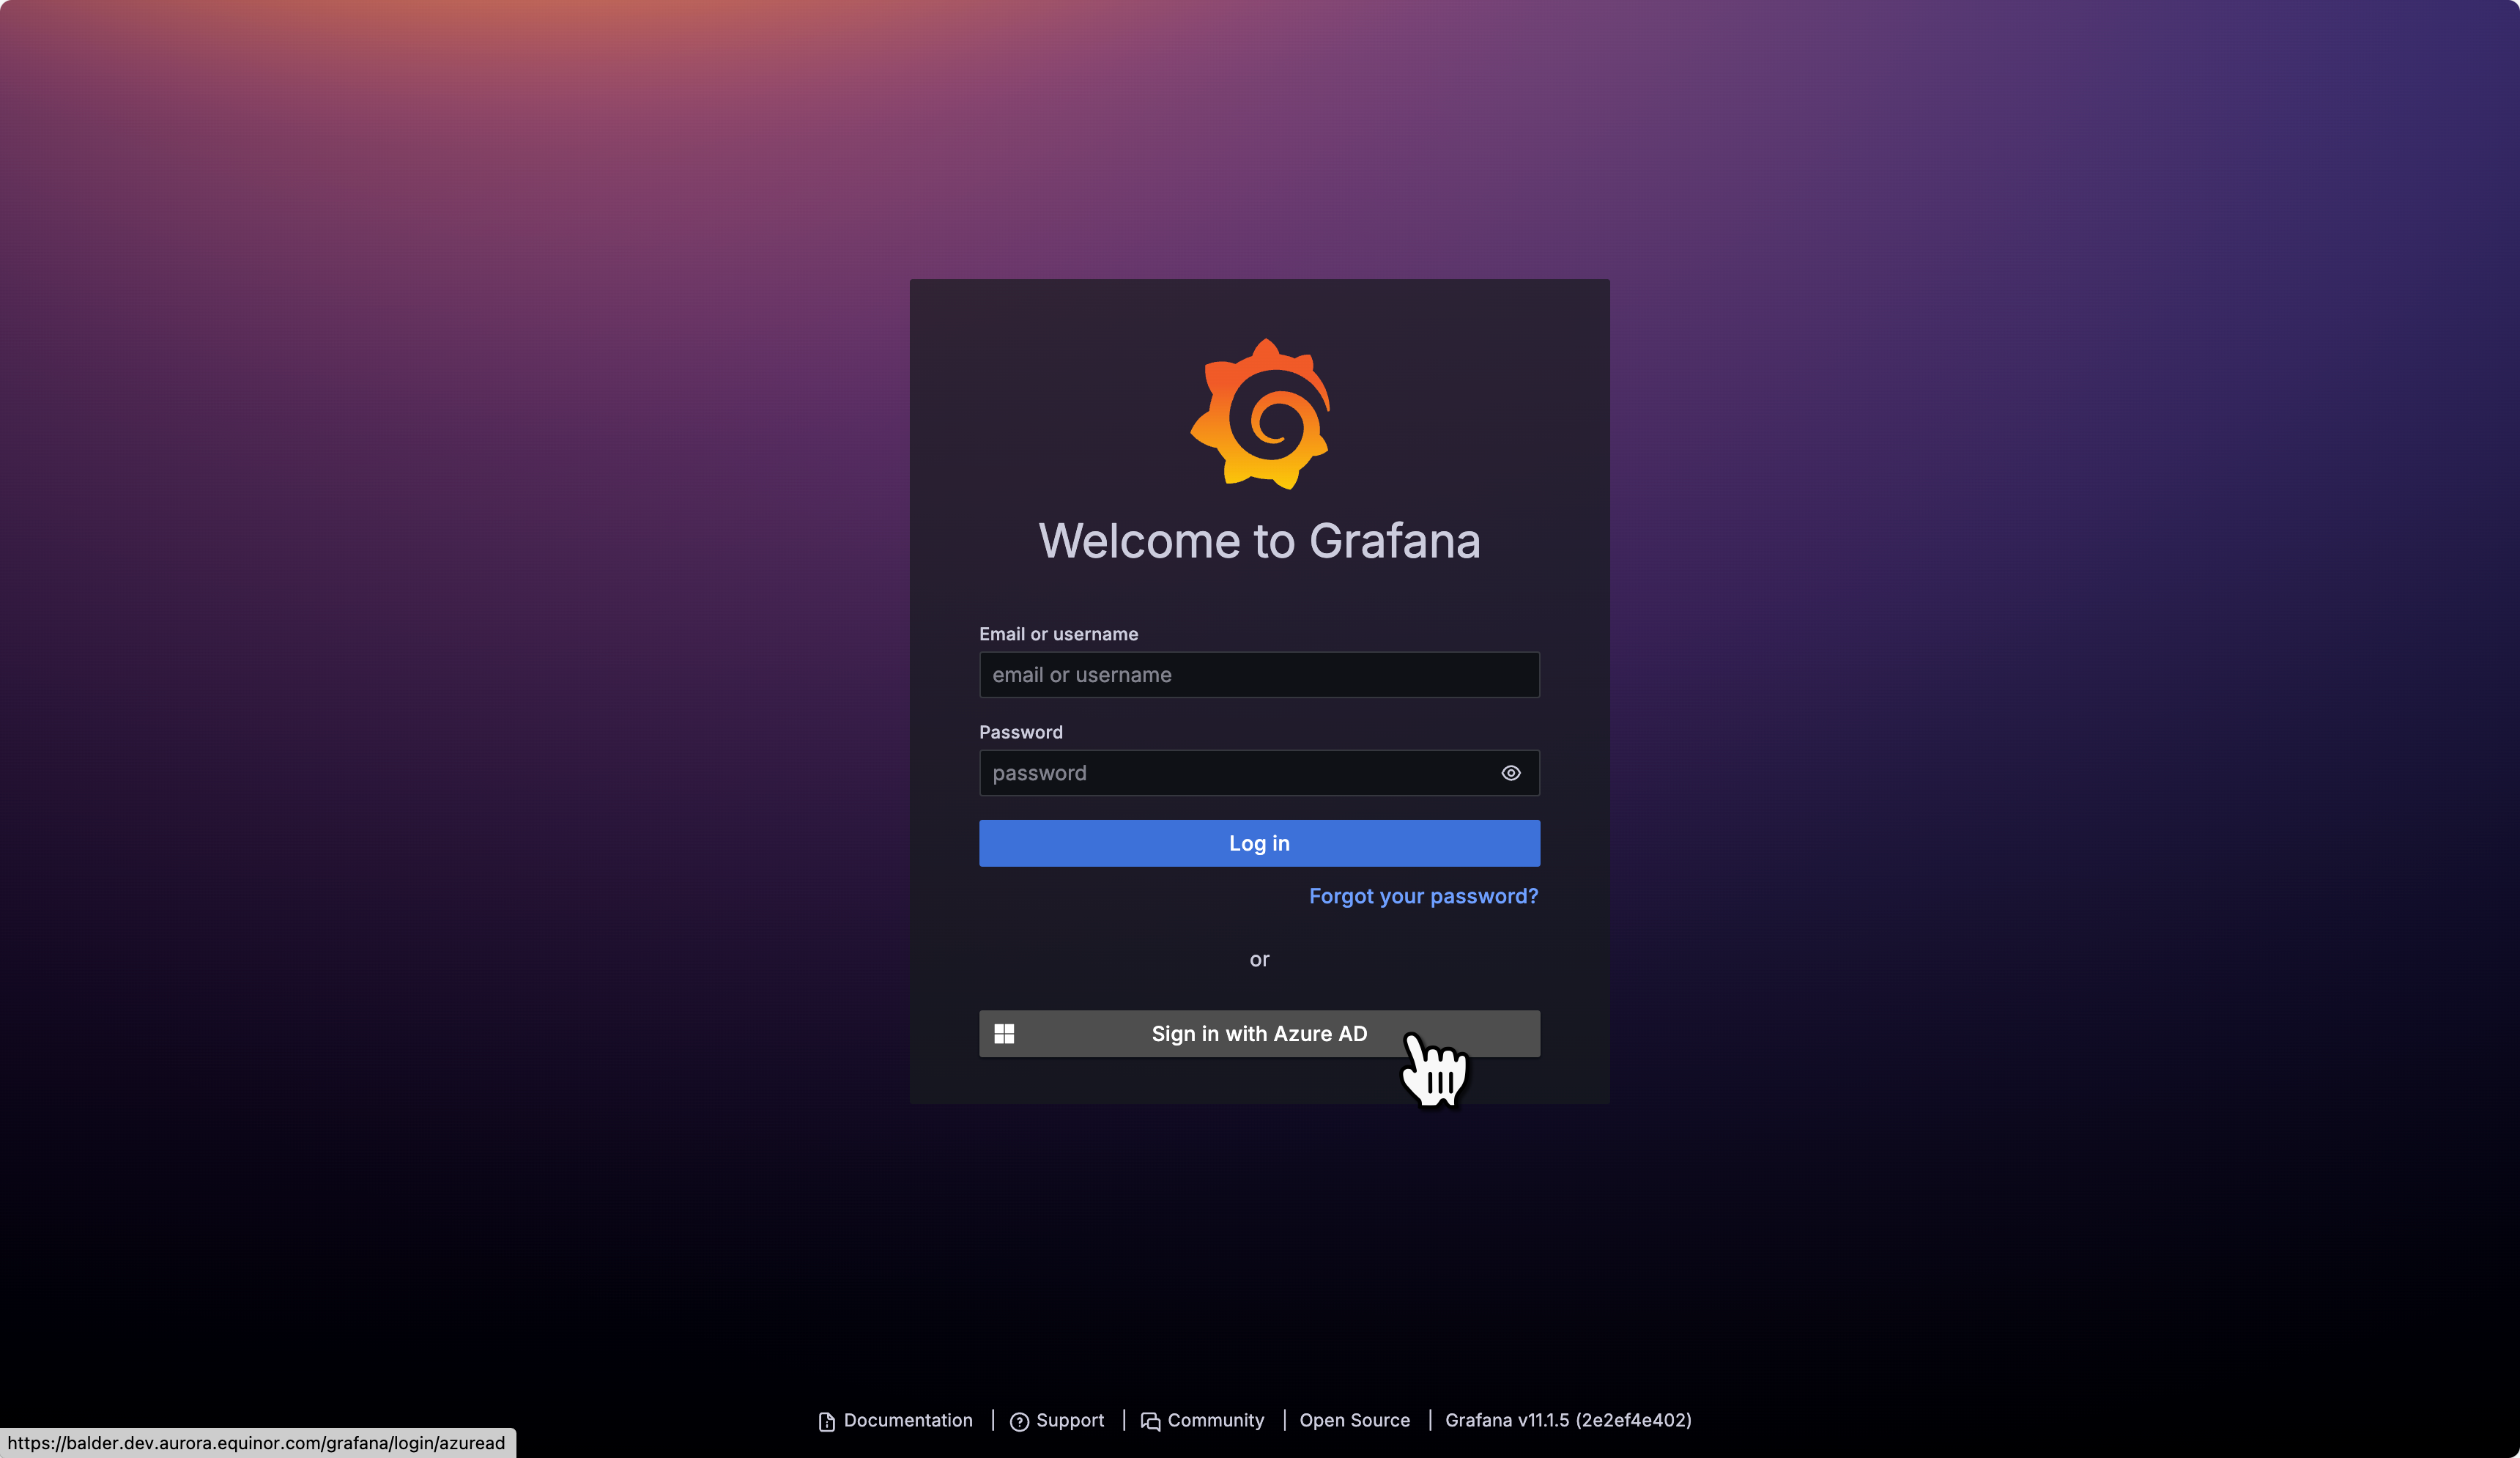 Grafana log in with SSO
- By default, you are granted read-only access.
- For editing permissions and access to the Explore section, contact the AI Platform team.
Available Dashboards
All dashboards are available in the Aurora folder, which is present in every Grafana instance.
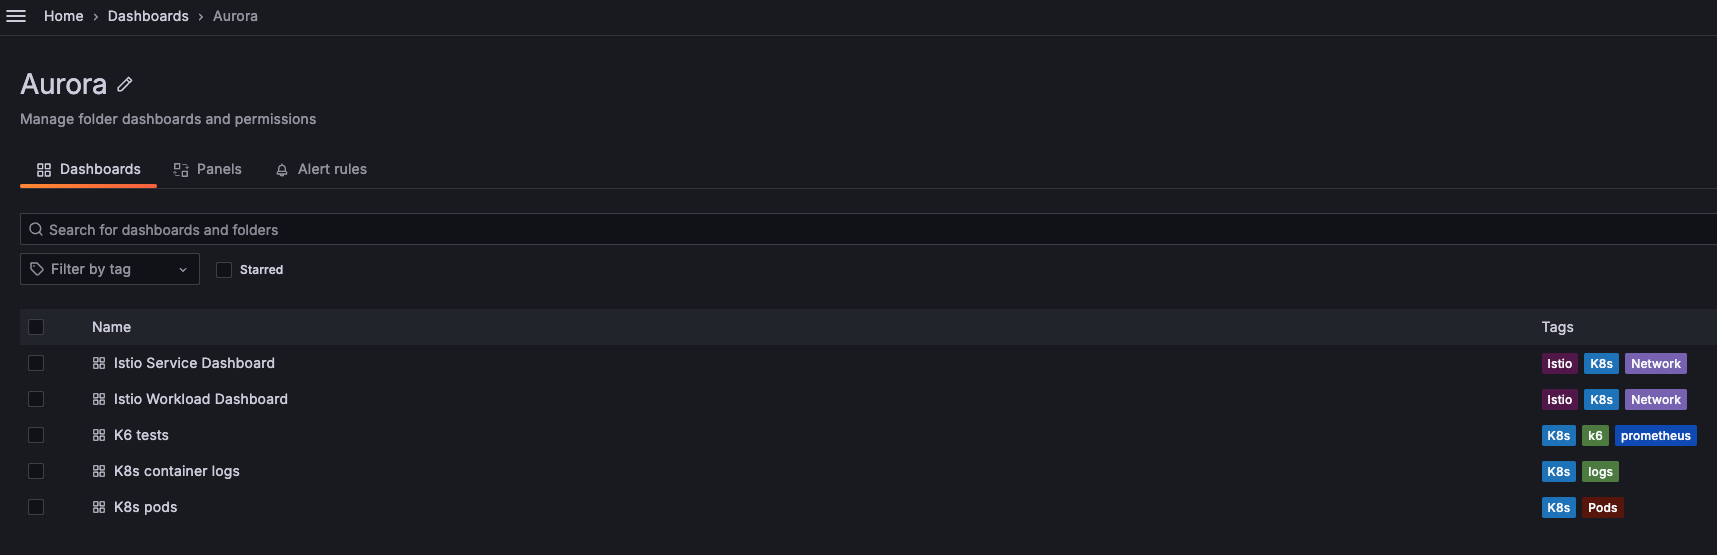 List of availabale Aurora dashboards in Grafana
Istio Service Dashboard
Individual Services View. This section provides metrics about requests and responses for each individual service within the mesh (HTTP/gRPC and TCP). This also provides metrics about client and service workloads for this service.
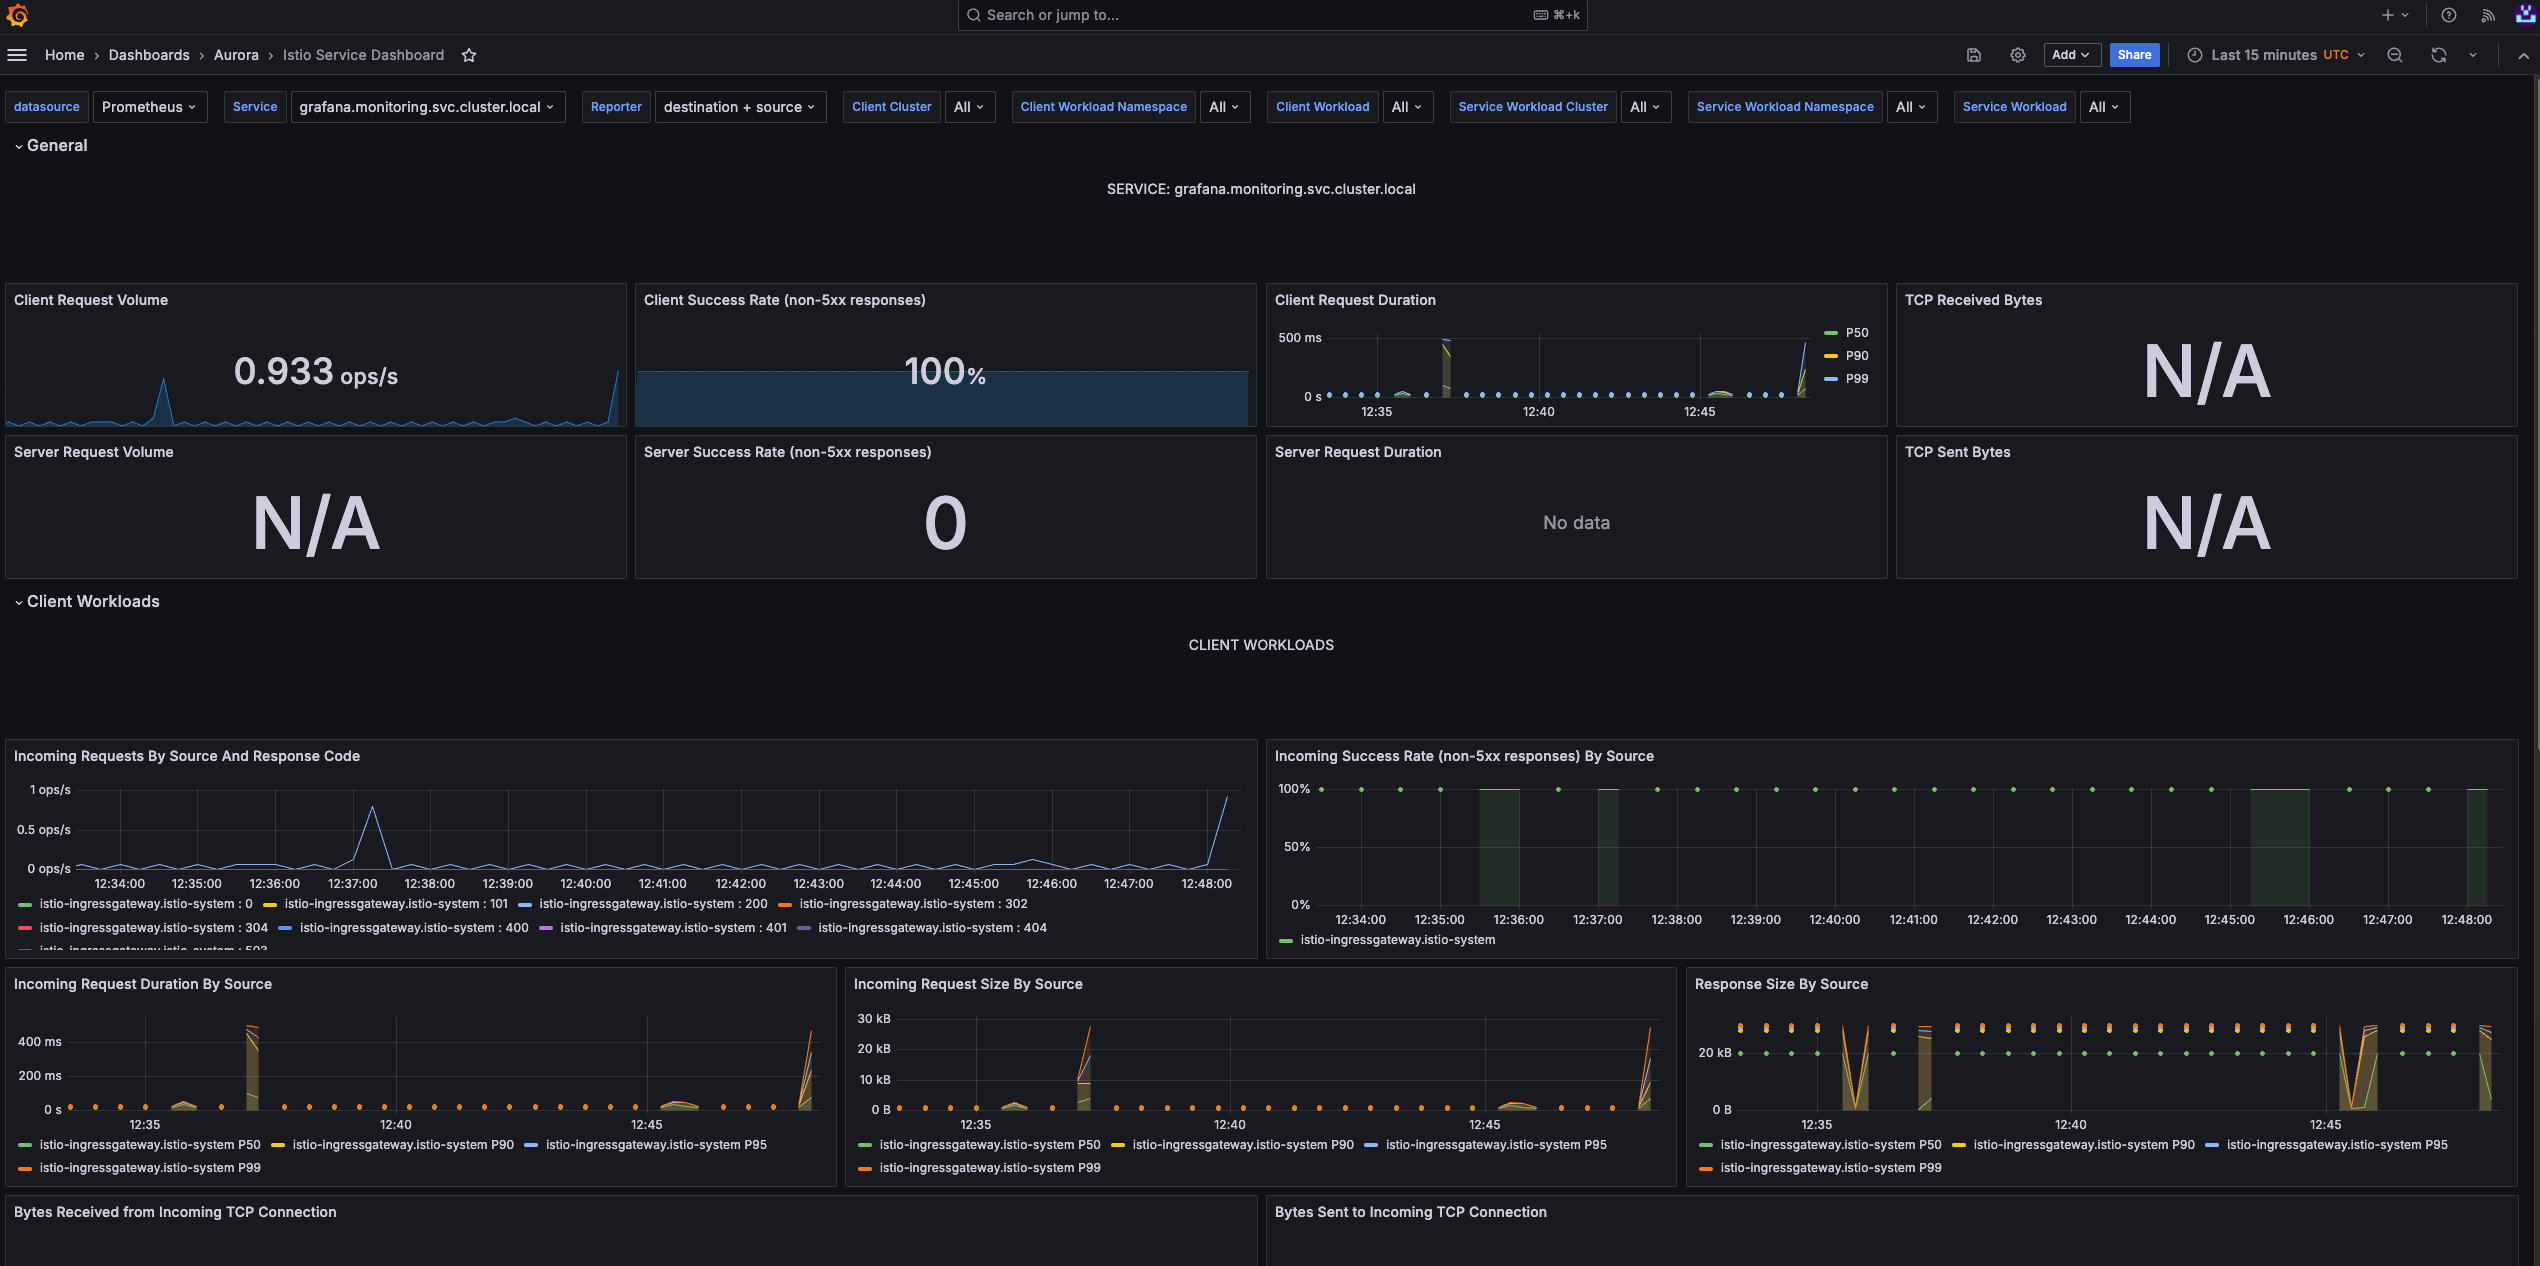 Individual services view
Istio Workload Dashboard
This section provides metrics about requests and responses for each individual workload within the mesh (HTTP/gRPC and TCP). This also provides metrics about inbound workloads and outbound services for this workload.
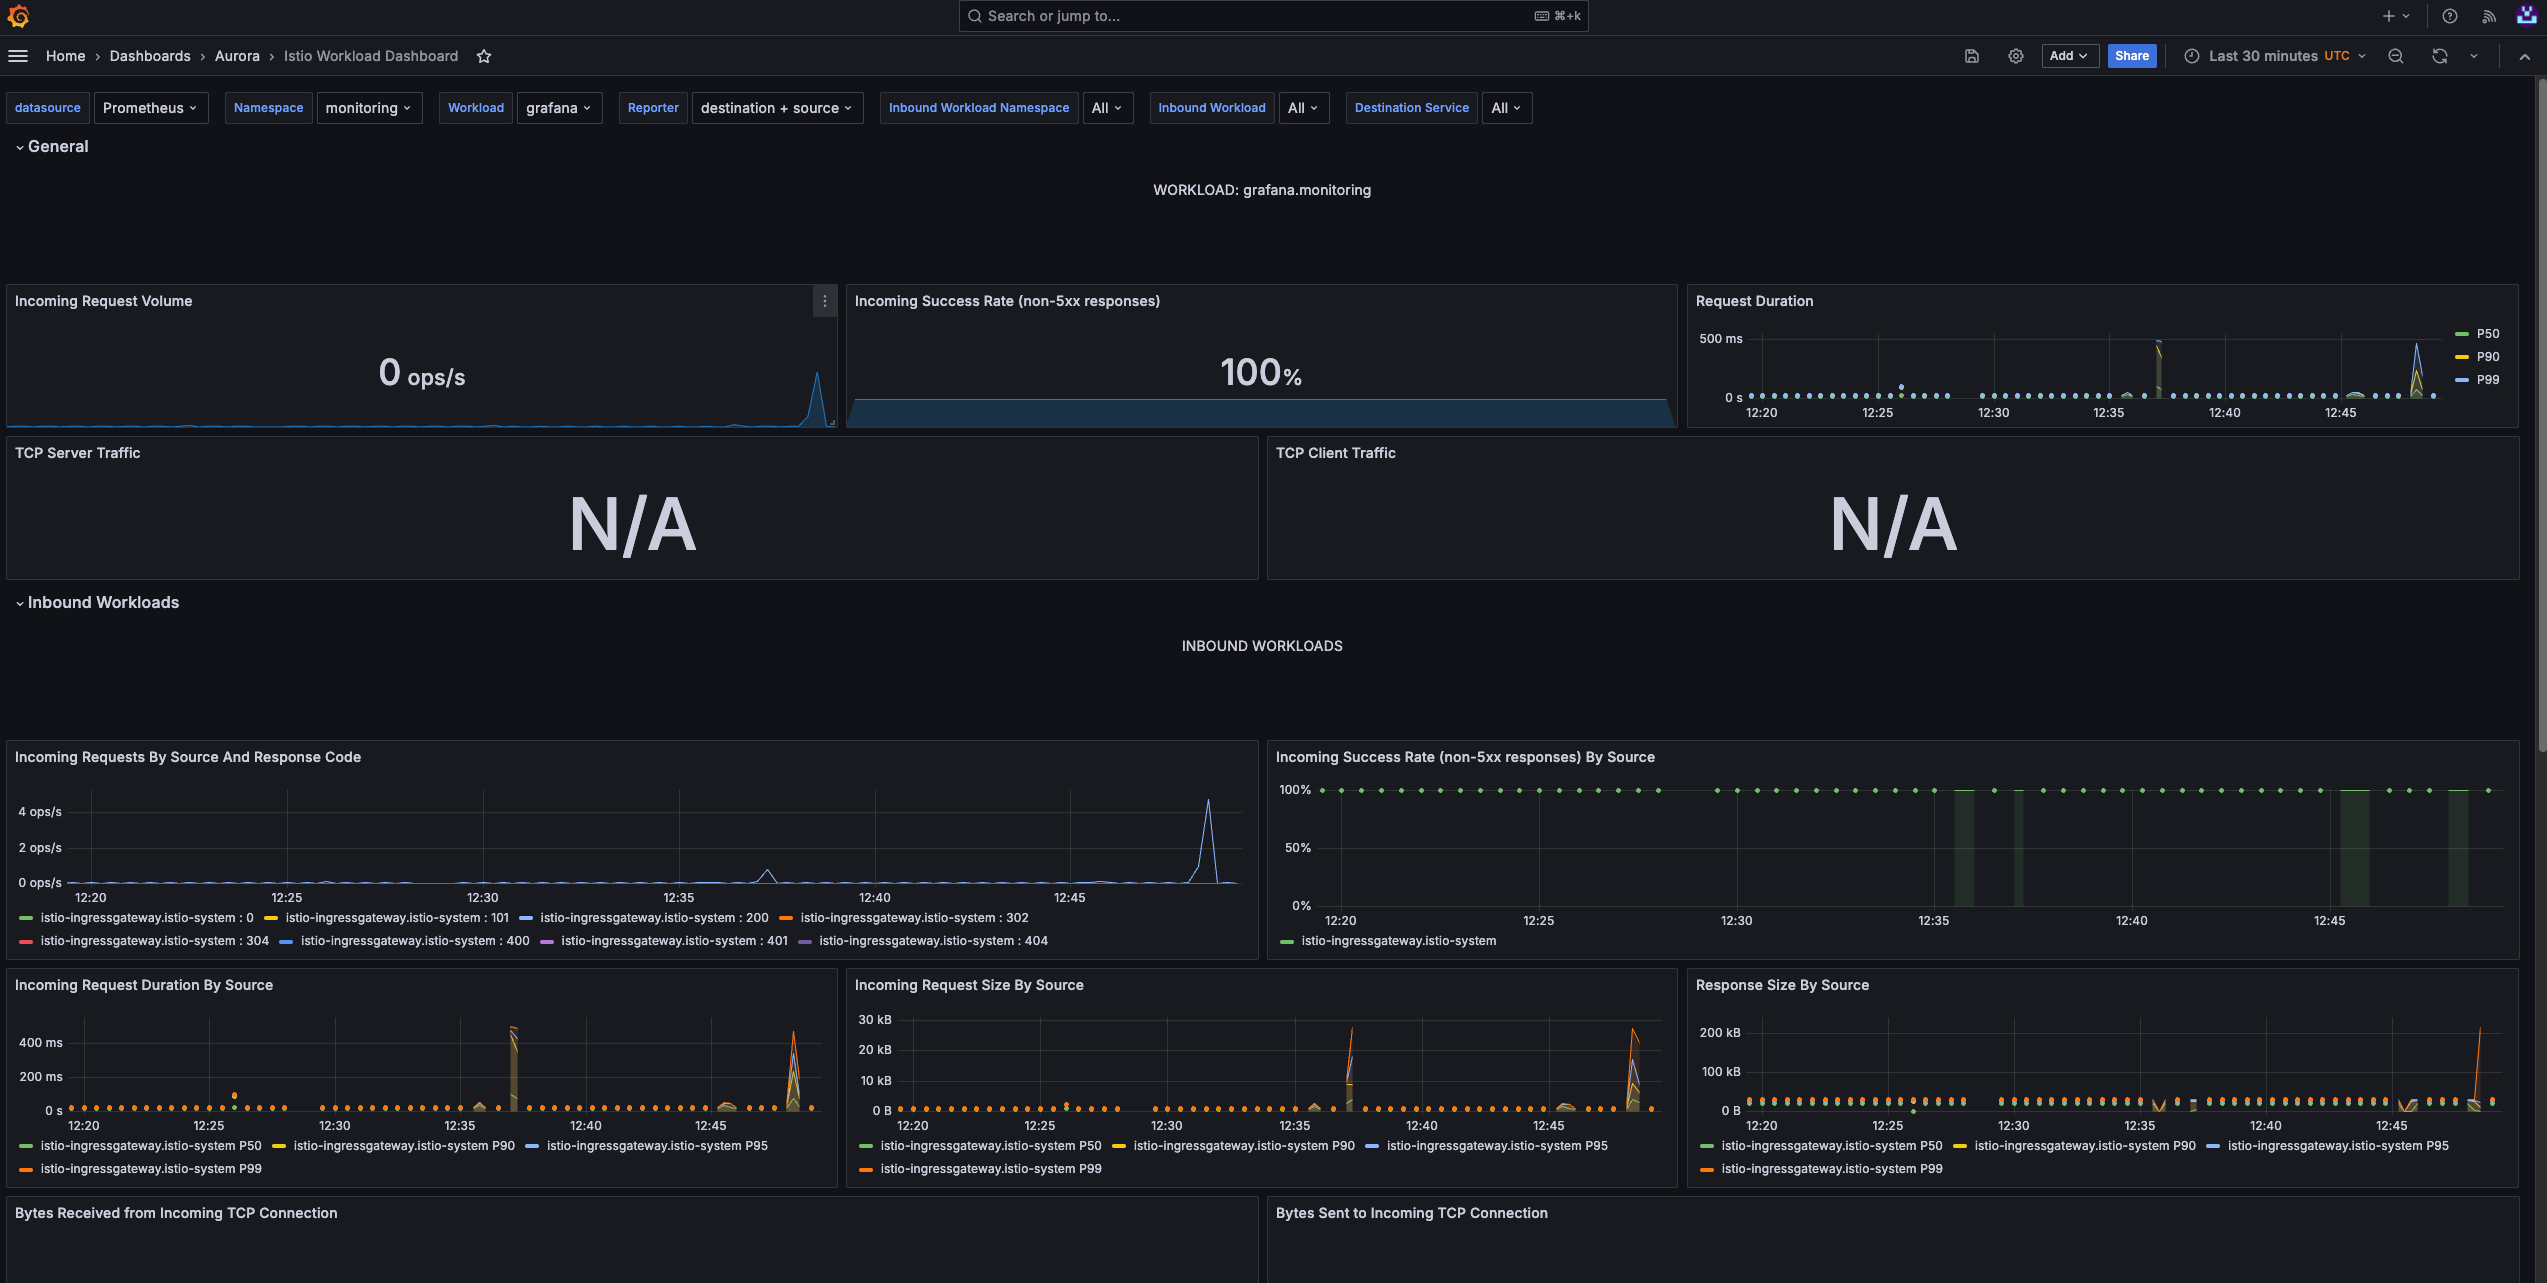 Istio workload
K6 Tests
Monitors the results of K6 load tests, including request rates, response times, and error percentages. It helps assess the performance and scalability of applications under various load conditions, supporting testing and optimization of critical endpoints and services.
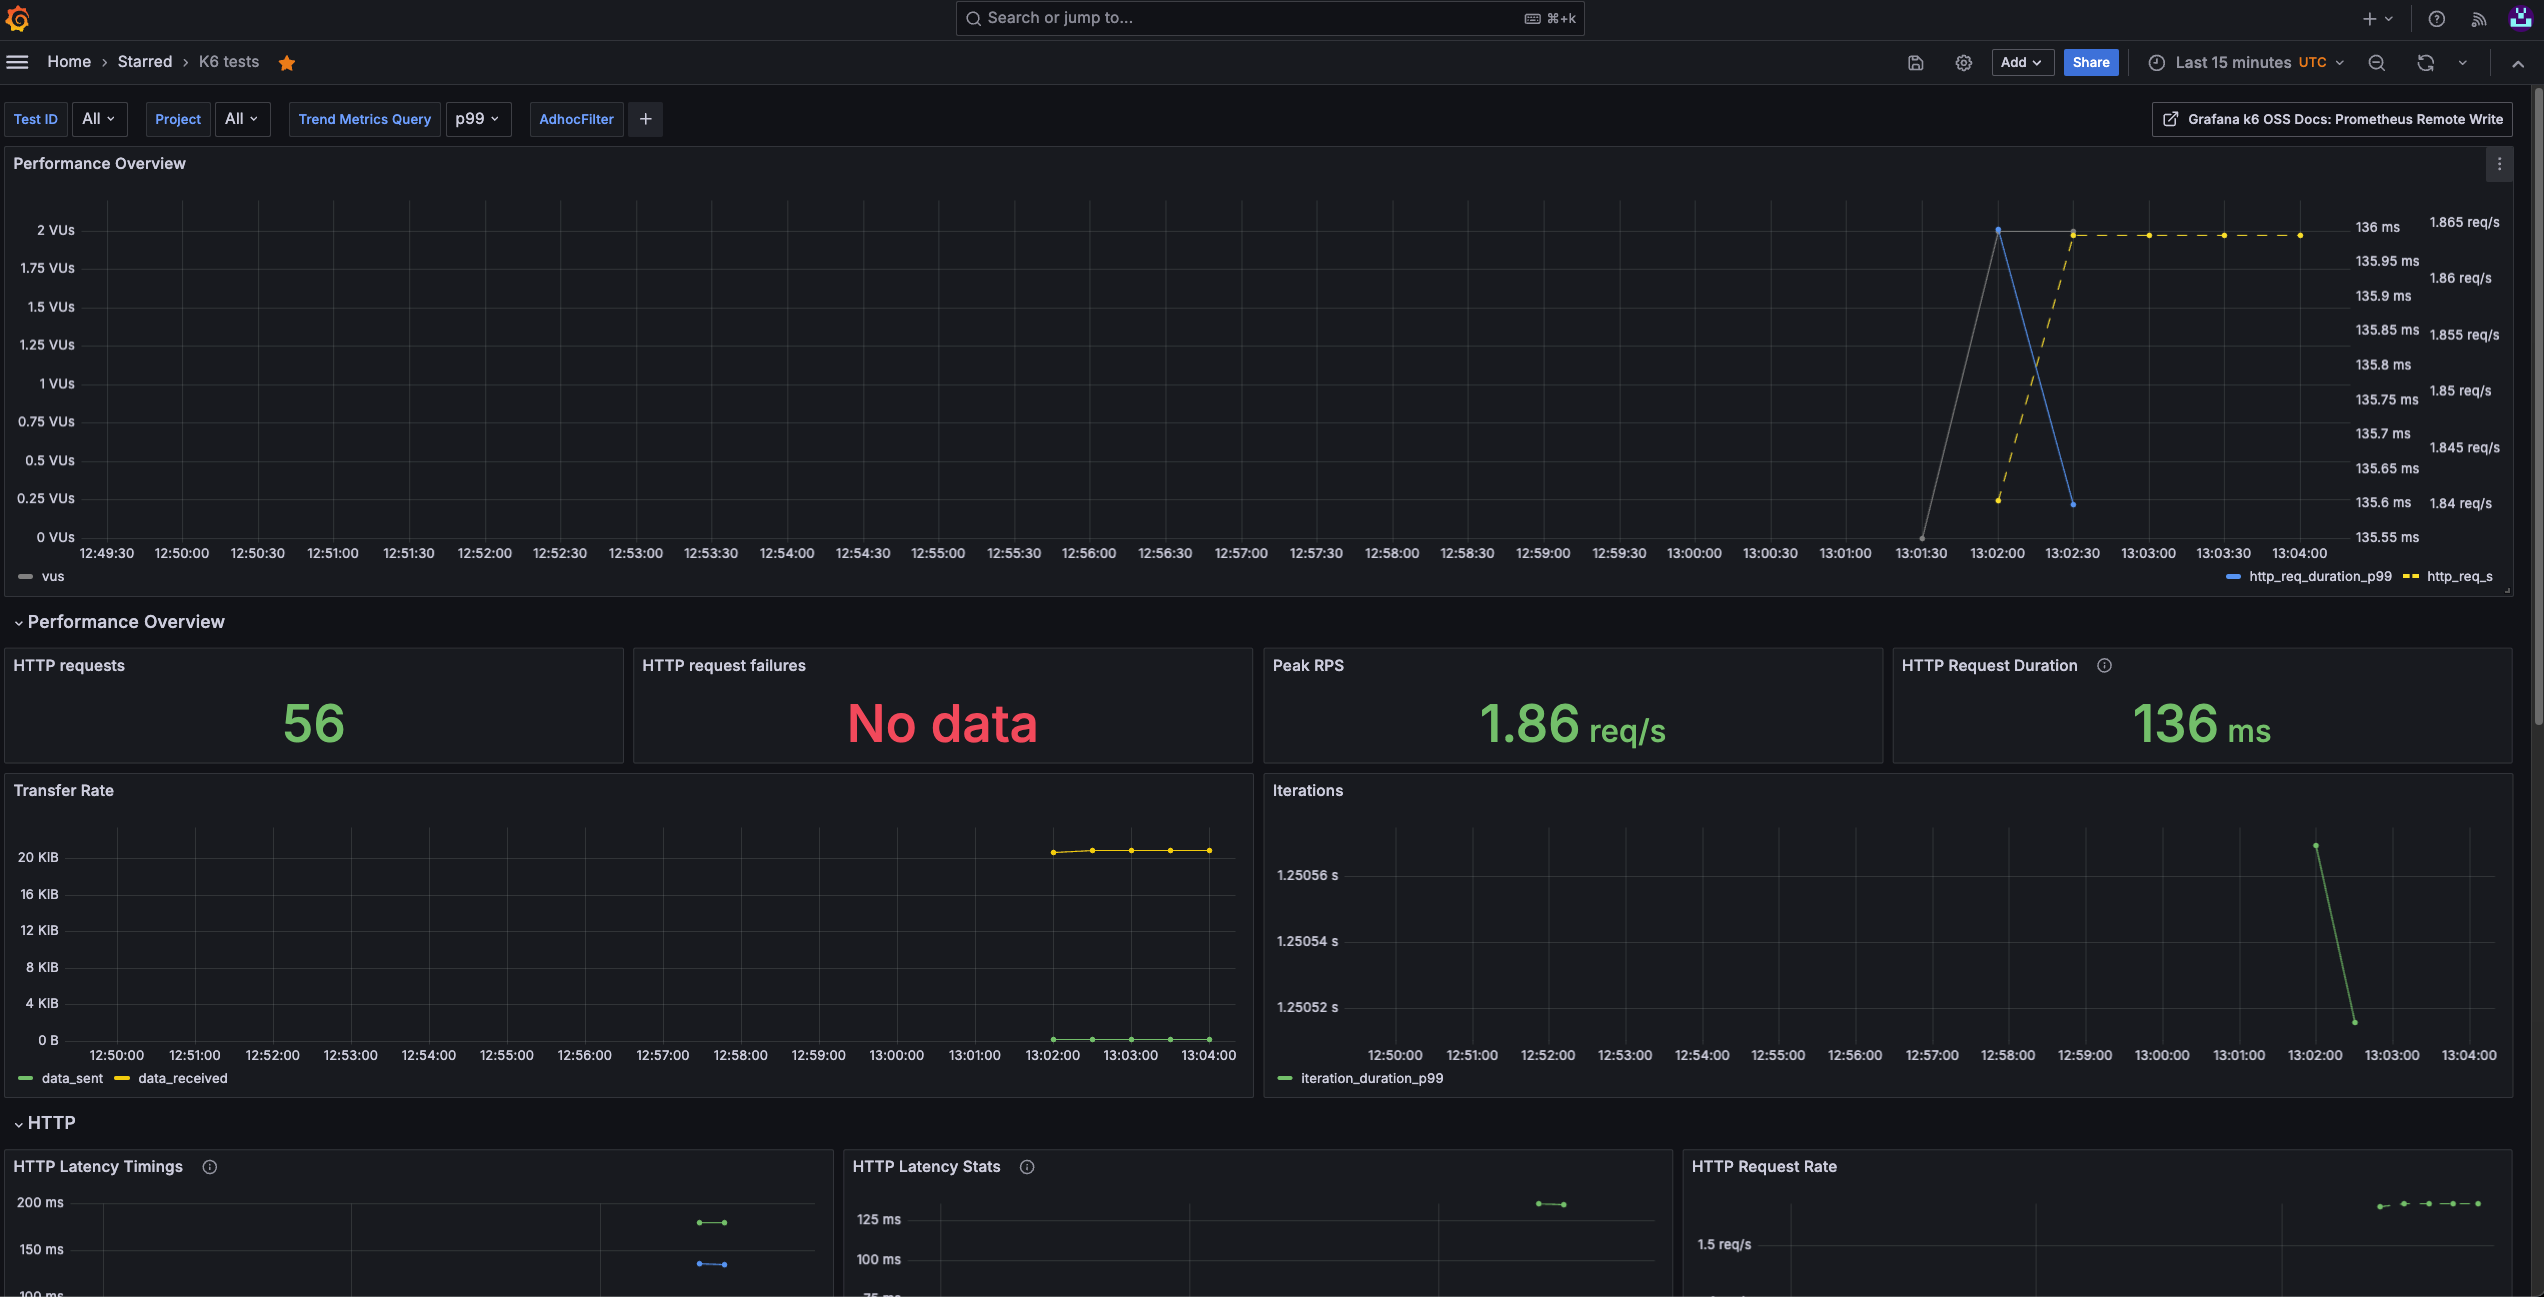 K6 tests
This dasbhoad should be used only on our shared Grafana which has access to Victoria Metrics.
Kubernetes Container Logs
Aggregates and displays logs from Kubernetes containers. This dashboard facilitates debugging by providing easy access to container-level logs, allowing us to track application behavior, diagnose issues, and ensure smooth operation within our clusters.
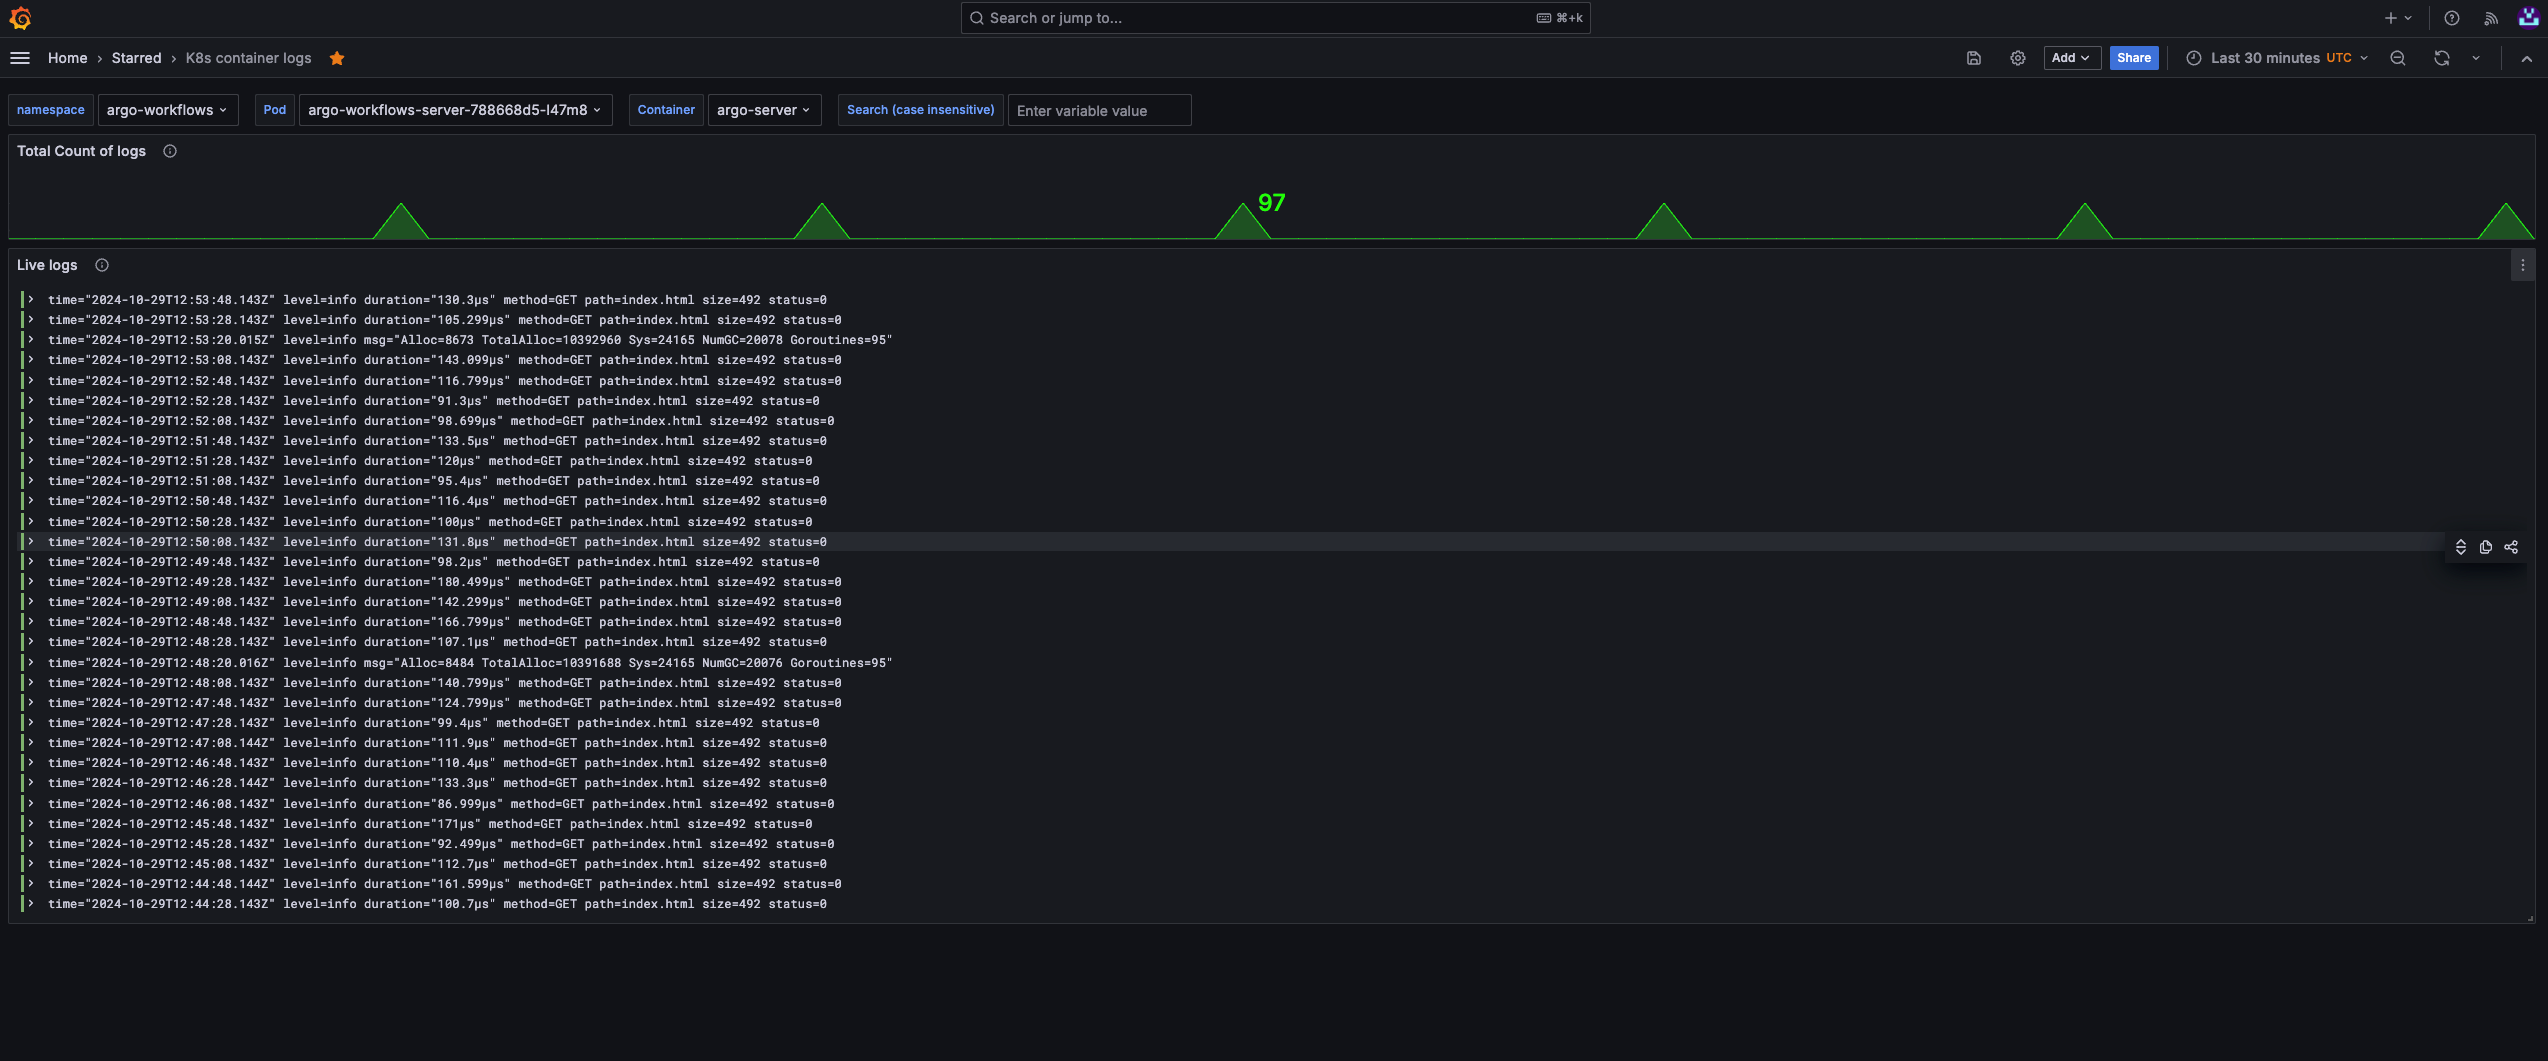 Kubernetes container logs
Kubernestes Pods
Provides an overview of pod-level metrics in the Kubernetes cluster, such as CPU, memory usage, and pod status. It’s essential for monitoring pod health, optimizing resource utilization, and maintaining stability across the cluster.
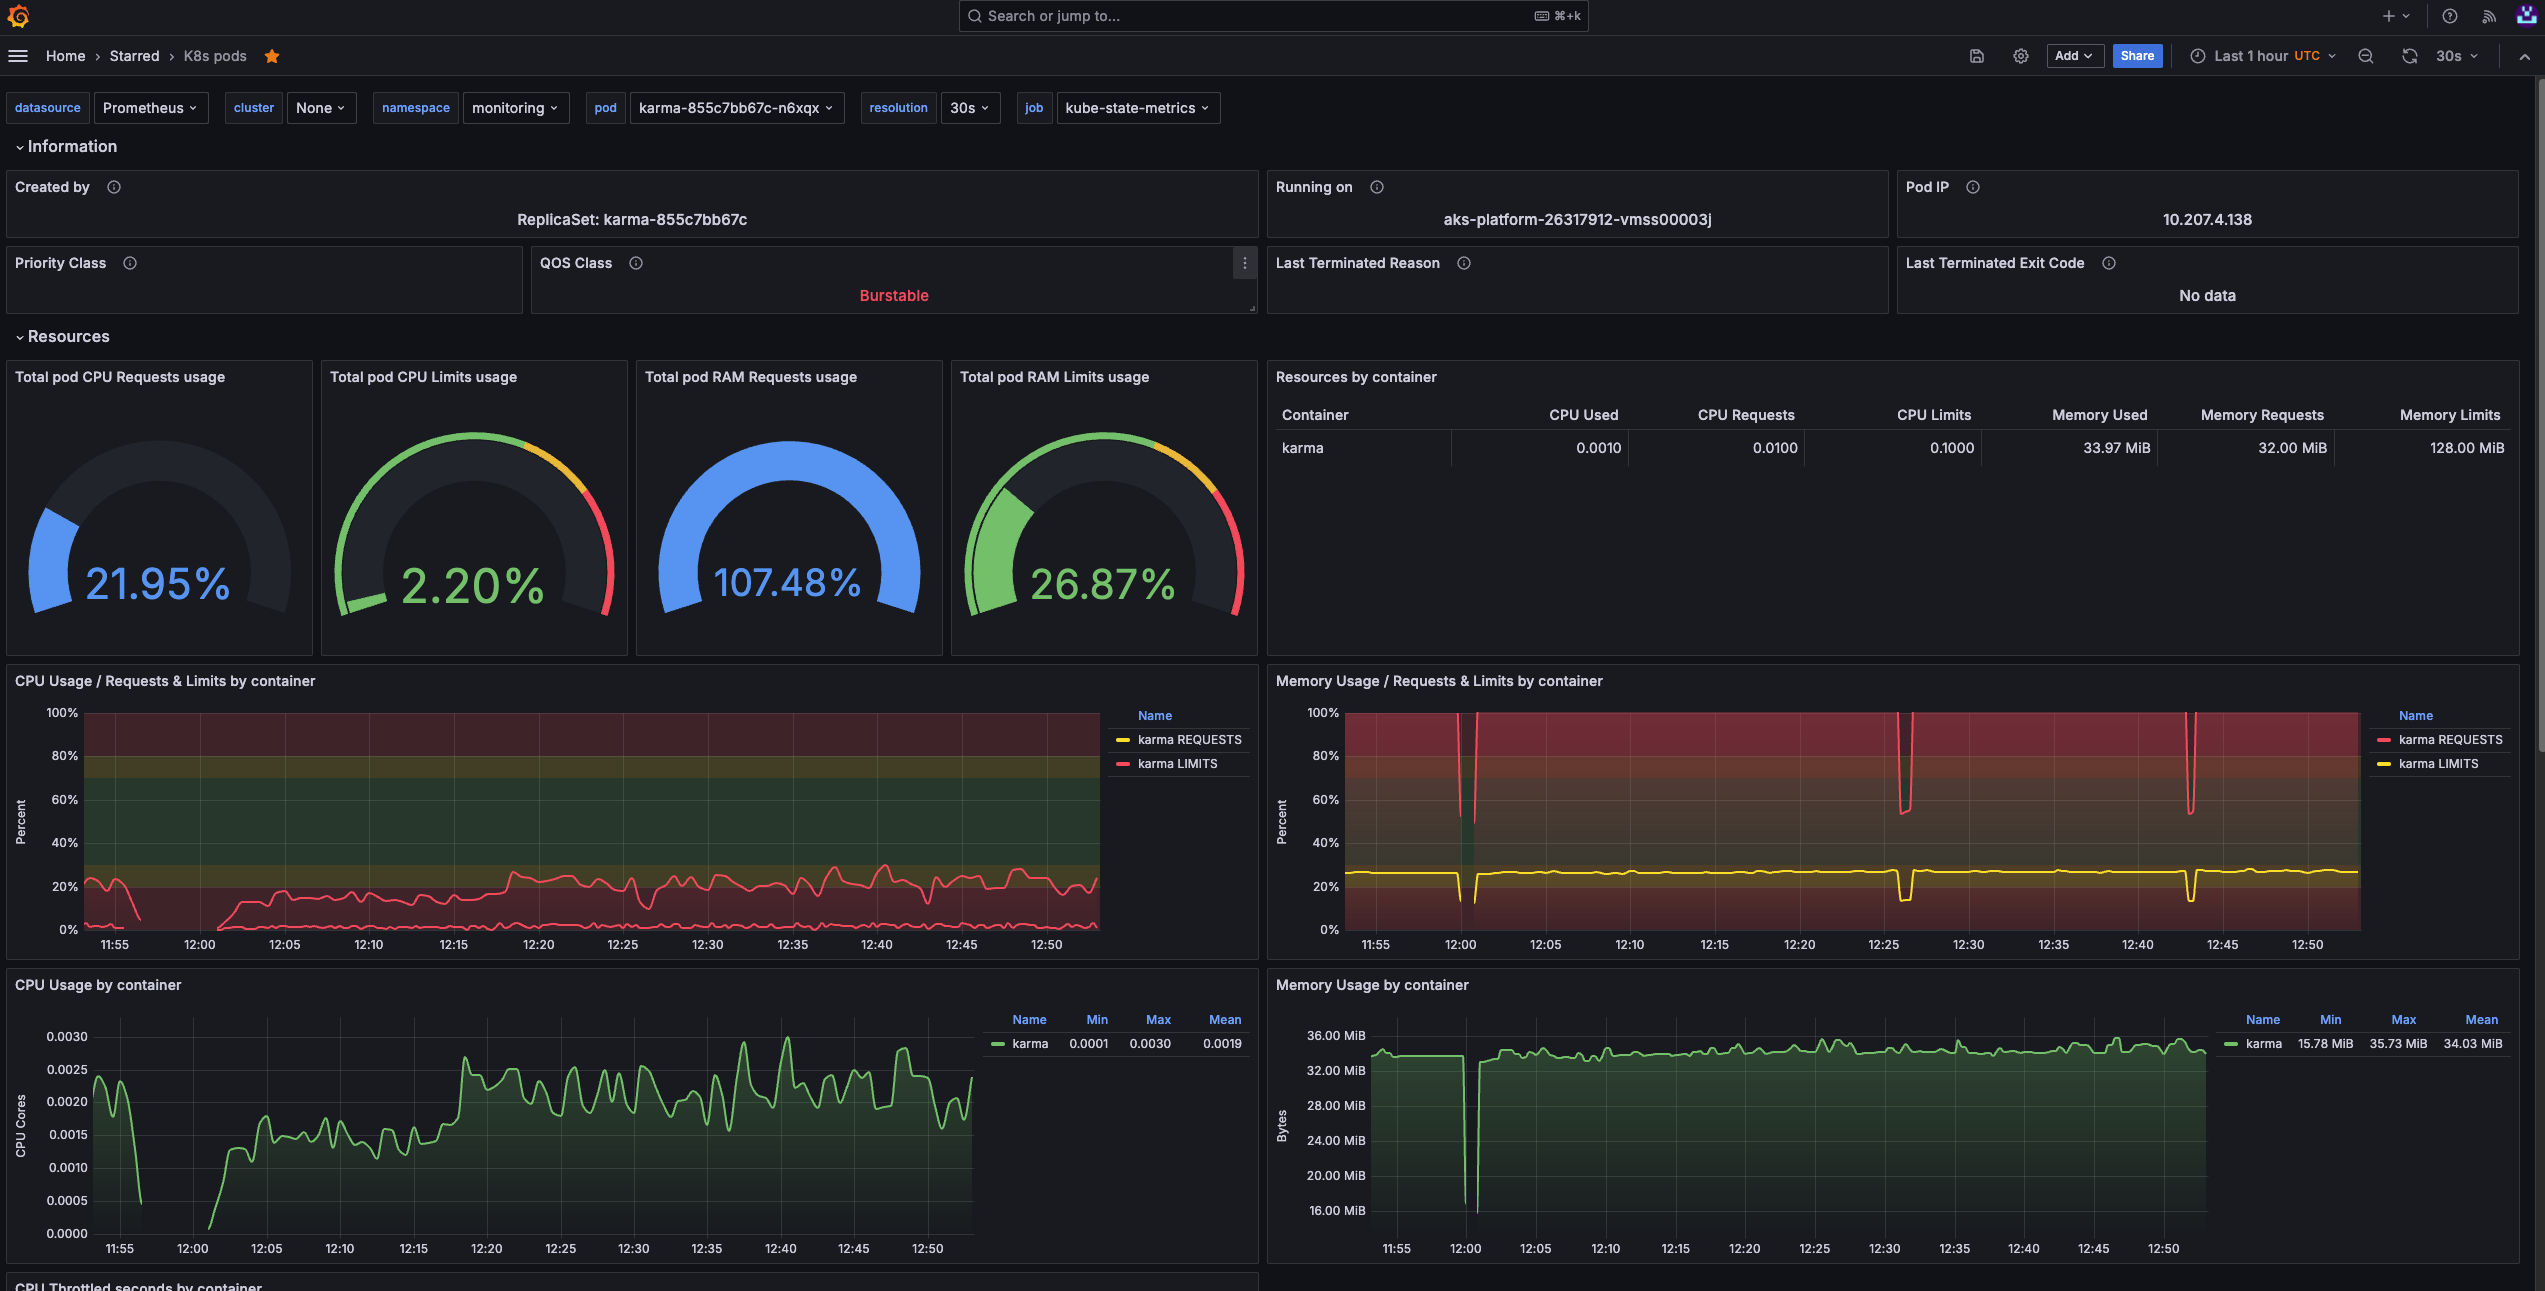 Kubernetes pods
Evidently AI
What is Evidently AI?
Evidently AI is an open-source Python library for data scientists and ML engineers. It helps evaluate, test, and monitor the performance of ML models from validation to production. It works with tabular, text data and embeddings.
Their key offering is model observability, which can be achieved through:
-
Tests: perform structured data and ML model quality checks. They verify a condition and return an explicit pass or fail result.
-
Reports: these can be seen in your Jupyter notebooks, but can also be integrated with Grafana. Reports calculate various data and ML metrics and render rich visualizations. You can create a custom Report or run a preset to evaluate a specific aspect of the model or data performance. For example, a Data Quality or Classification Performance report.
-
Real-time ML monitoring: Evidently has monitors that collect data and model metrics from a deployed ML service. You can use it to build live monitoring dashboards (Grafana).
For information, examples, and guides provided by Evidently AI, go to:
For the original integration guide and examples provided by Equinor's AI Platform team, go to:
Using Evidently AI (tutorial)
Prerequisites
The different tutorials on this page require a range of tools that you have installed on your machine or have access, such as:
- Azure Portal
- Kubeflow Central Dashboard
- Jupyter Notebook
- MLflow
- Docker
- Grafana
- Make
- Python
- IDE
- GitHub
Running locally
- Clone the ai-platform-advanced-usecases/evidentlyAI repository on your local machine.
- With your preferred method, run the basic_example.ipynb notebook .
This notebook example covers how to create reports based on Evidently metrics. - Print the different reports to understand what these look like.
Deploying metrics to MLflow
Integrating your metrics with MLflow is possible. The two Jupyter notebooks in the mlflow_integration/ folder demonstrate how to do this.
If your goal is to run the notebooks (or Python script) in AI Platform, you will first need to get an MLflow instance running in your namespace which we can then point to.
How to set up an MLflow instance
To set up an MLflow instance, follow these steps:
-
If you haven't done so already, from the Azure Portal, create an Azure storage account.
-
In the Azure Portal, go to Storage account > Security + networking > Access keys and collect the following values:
- Azure storage account
- Azure storage key
- Container name
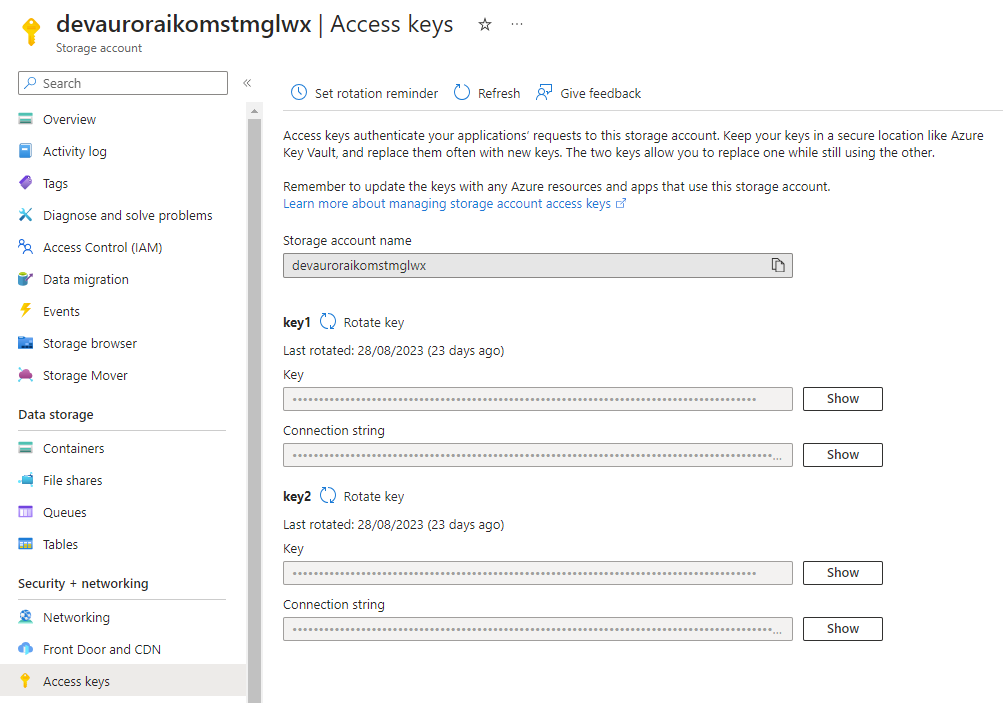 Azure storage access key
 -
Go the Kubeflow Central Dashboard of your corresponding cluster and in the navigation menu, click
Applications.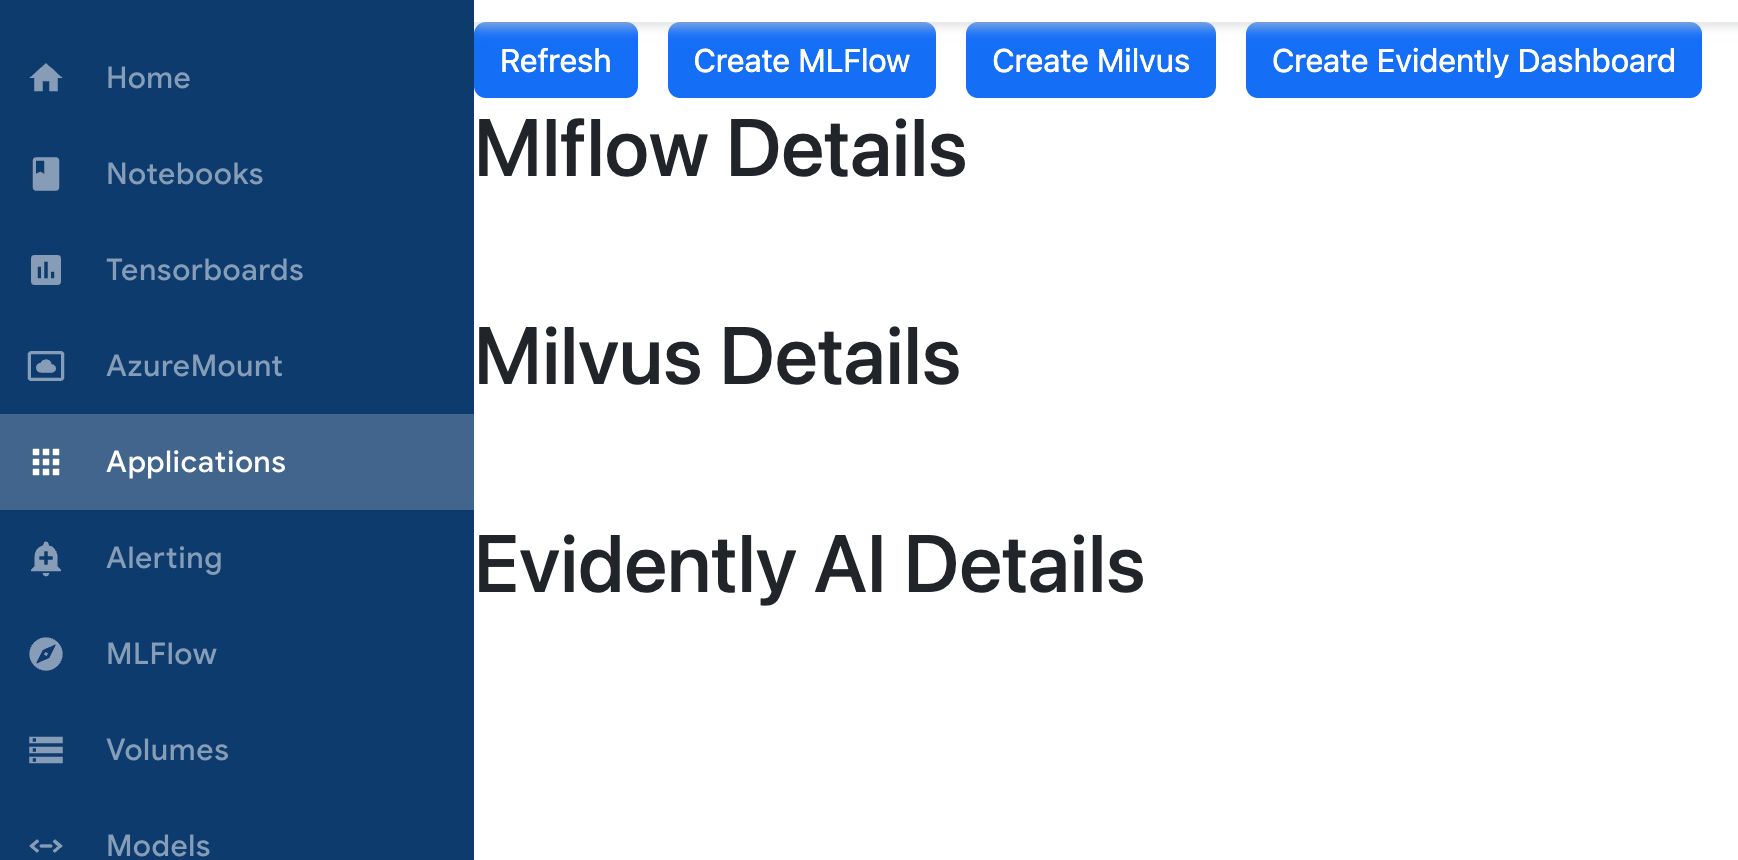 Applications section in Kubeflow Central Dashboard
 -
Click Create MLFlow.
-
Fill in the dialog box with Azure storage account data.
-
Point your scripts to the MLflow server running in Aurora by editing the line that sets the tracking URI in your notebook / script. This was added to both notebooks and will need editing before you can run your example:
client = MlflowClient()
mlflow.set_tracking_uri("http://aurora-mlflow.<namespace>.svc.cluster.local:5000") # change this to your MLflow's internal URI
#set experiment
mlflow.set_experiment('Data Drift Evaluation with Evidently') -
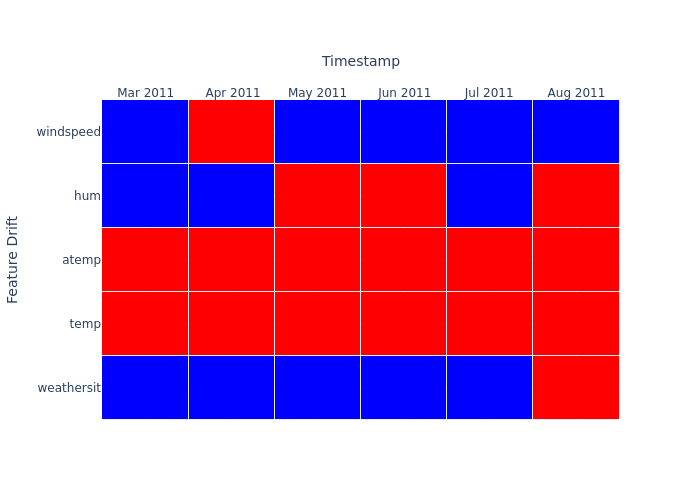
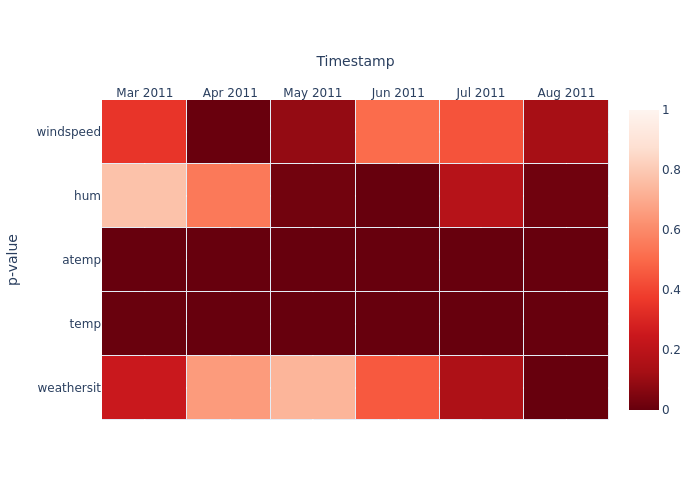
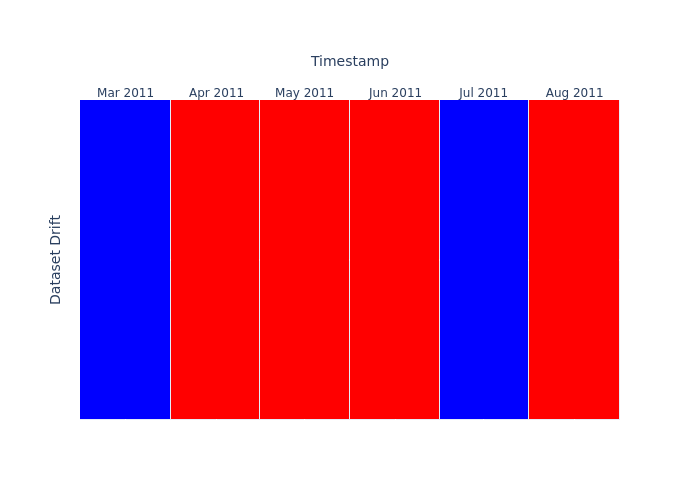
Open the MLflow UI using the external URI and you will be able to visualize the metrics. These are the graphs displayed in the
historical_drift_visualization.ipynbnotebook:-
Feature drift
-
p-value:
-
Dataset Drift:
-
Running on AI Platform with Grafana
The example in the prometheus_integration/ folder gives you a use case to deploy a model using Evidently AI on AI Platform.
This example is a more advanced use case of the monitoring capability offered by Evidently AI. In this example, we are spinning up a basic flask app with a GET endpoint (/metrics) for metrics, and a POST endpoint (/iterate)
The prometheus_integration/metrics_app folder contains the source code for the monitoring app. The config.yaml file contains the information needed to parse the data correctly, including the type of monitoring we'd like to do for each data source (bike_random_forest, bike_gradient_boosting, kdd_k_neighbors_classifier), the column mapping including categorical and numerical features for each dataset, and other relevant parameters. This can be adapted to your use case.
Steps to run the Prometheus integration in AI Platform
To run this example on AI Platform, follow these steps:
-
From the repository, open a terminal and go to the
prometheus_integrationfolder:cd prometheus_integration -
From the terminal, run the
scripts/download_datasets.pyscript to download the datasets needed for the example.python3 scripts/download_datasets.py -
Run Make to compile the Docker image and push it to the
auroradevacrrepository.make imagenoteFeel free to change the image name to whatever you want and reuse this for other use cases. You can pass the
GIT_TAG(image tag) as a variable. -
Edit the
deployment.yamlfile. It covers the infrastructure needed for this example. This includes:- a deployment which will spin up a pod with your flask app
- a service which exposes your pod's ports
- a virtual service which creates a URL that you can then access and gives you visibility of the exposed ports.
noteWithin the in the YAML file, review the following:
- Ensure that the port number of
Deployment,Service, andVirtualServicematch. - The string present in the
prefixfield in the virtual service resource is the URL path that you will then type on your browser to find the metrics. Change this to something meaningful.
-
Deploy the resources.
kubectl apply -f deployment.yaml -n <namespace>noteAfter your pod is running, you will be able to visit the app's metrics. The URL follows the
<cluster_url>/<prefix>/metricsstructure, for example:https://balder.dev.aurora.equinor.com/evidentlyai/metrics -
To send requests to your app:
-
Open with your code editor the
scripts/example_run_request.pyscript. -
Ensure that the address in line 45 is correct and matches the resource you have created (keep the /iterate suffix).
-
Run the
scripts/example_run_request.pyscript.python3 scripts/example_run_request.py
You should see several "success" messages appear. If you reload the
<cluster_url>/<prefix>/metricswebsite you will start seeing your Evidently metrics come through.noteThe commented line 46 in
scripts/example_run_request.pyshows how to send requests to a local service, which you can spin up by runningpython3 -m flask run --host=0.0.0.0 --port=8000in a second terminal window (this would need to be run from within themetrics_appfolder). You can then uncomment that line and comment the remote URL one and send requests the same way. -
Visualizing metrics
There are 5 reusable dashboards in Grafana which you are welcome to make a copy of and edit them to adapt them to your use case:
- Evidently Regression Performance Dashboard
- Evidently Numerical Target Drift Dashboard
- Evidently Data Drift Dashboard
- Evidently Classification Performance Dashboard
- Evidently Categorical Target Drift Dashboard
You can explore the metrics you have just created with these dashboards.
Visualizing reports and workspaces
Set up a workspace to organize your data and projects
A workspace means a remote or local directory where you store the snapshots. Snapshots are a JSON version of the report or a test suite which contains measurements and test results for a specific period. You can log them over time and run an Evidently monitoring dashboard for continuous monitoring. The monitoring UI will read the data from this source. We have designed a solution where your snapshots will be stored in your Azure blob storage, making them easily available and shareable.
How to set up Evidently AI dashboard through the Kubeflow Central Dashboard
To set up your own Evidently AI server, you will need to carry out the following steps:
-
Create or use an existing storage account in the Azure Portal.
-
Collect the following values from the storage account:
- Azure Storage Account
- Container Name
- Azure Storage key
Storage account details -
Open the Kubeflow Central Dashboard through the URL of your corresponding cluster. For example, Balder's cluster:
https://balder.dev.aurora.equinor.com/).noteIf you don't have a personal or team profile, ask the AI Platform team to create this on your behalf.
-
In the navigation menu, click Applications.
-
Click Create Evidently Dashboard.
-
Enter the values corresponding to the Azure storage account and click Create.
This will spin up the relevant resources in the background for you. -
Click Refresh to reload the page and get information relevant to your Evidently AI server.
This includes the internal URL which will be used when setting up yourWORKSPACE, as well as the external URL, which directs you to the UI.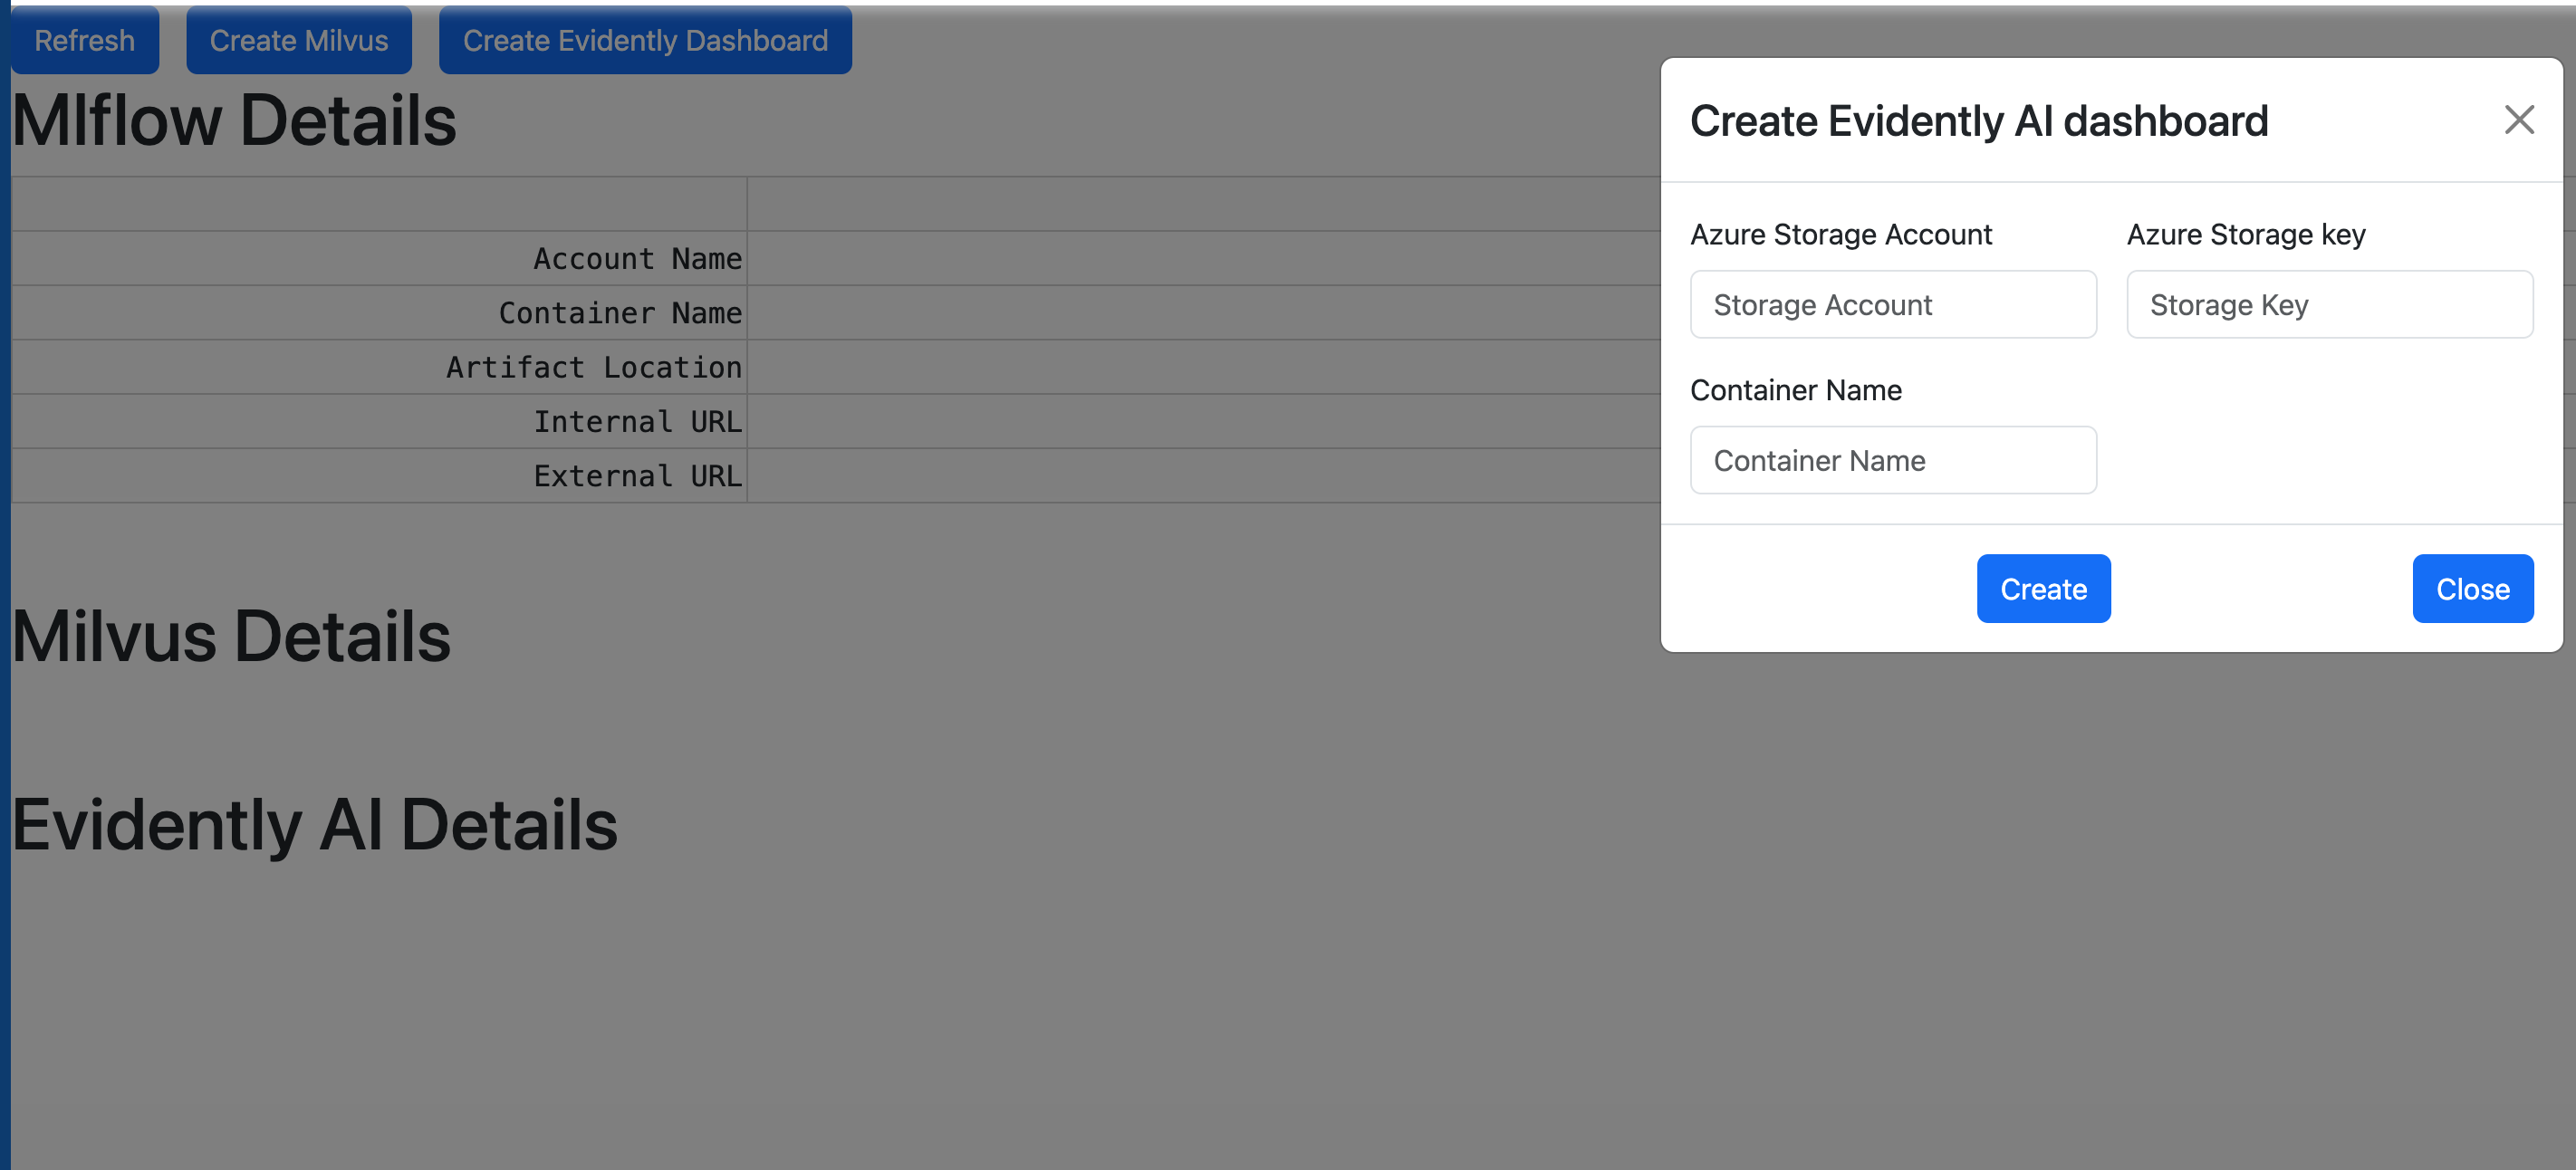 Create Evidently AI dashboard dialog box
Connect to your server
After generating the snapshots, you will send them to the remote server. You must run the monitoring UI on the same remote server, so that it directly interfaces with the filesystem where the snapshots are stored.
To create a remote workspace, the UI should be running at this address:
workspace = RemoteWorkspace(f"{the internal URI returned by the Kubeflow app creation})
For example:
workspace = RemoteWorkspace("http://aurora-evidently.\<namespace\>.svc.cluster.local:8080)
Building reports
Create a Jupyter notebook server or VSCode server and run the workspace_ui.ipynb script. Make sure the variable WORKSPACE shows the Internal URL that was output when you created the Evidently UI dashboard: Kubeflow Central Dashboard > Applications
Custom metrics with Prometheus
To create and monitor your own metrics calculated from Python scripts on AI Platform, refer to the methodology shown in the following documentation: