Alerting Plugin Guide
This section guides you through setting up alerts with the Kubeflow alerting plugin. The alerting plugin uses Prometheus and Grafana to monitor system metrics and send notifications to a specified Slack channel when issues occur. Follow these steps to create an alert in the alerting plugin.
Prerequisites
You'll need access in Slack for the following:
- create a channel
- install apps
Step-by-Step Guide
Step 1: Create a Slack channel and app
- In Equinor's Slack workspace, create a new channel where alerts will be posted by the Kubeflow plugin.
- Use a descriptive name for the channel. For example,
#myteam-kubeflow-alerts.
- Use a descriptive name for the channel. For example,
- Create a Slack app and add it to the channel you created.
- Generate a webhook for the app. This webhook will be used by the Kubeflow alerting plugin to post messages to the Slack channel.
Go to the Slack's Quickstart guide to help you create an app and set up the webhook.
Step 2: Define an alert group
Now, you will have to create an alert group. An alert group is a logical grouping of alerts. Use alert groups to organize related alerts.
To start setting up an alert group, follow these steps:
- Go to the Kubeflow Central Dashboard, and on the navigation menu, click Alerting.
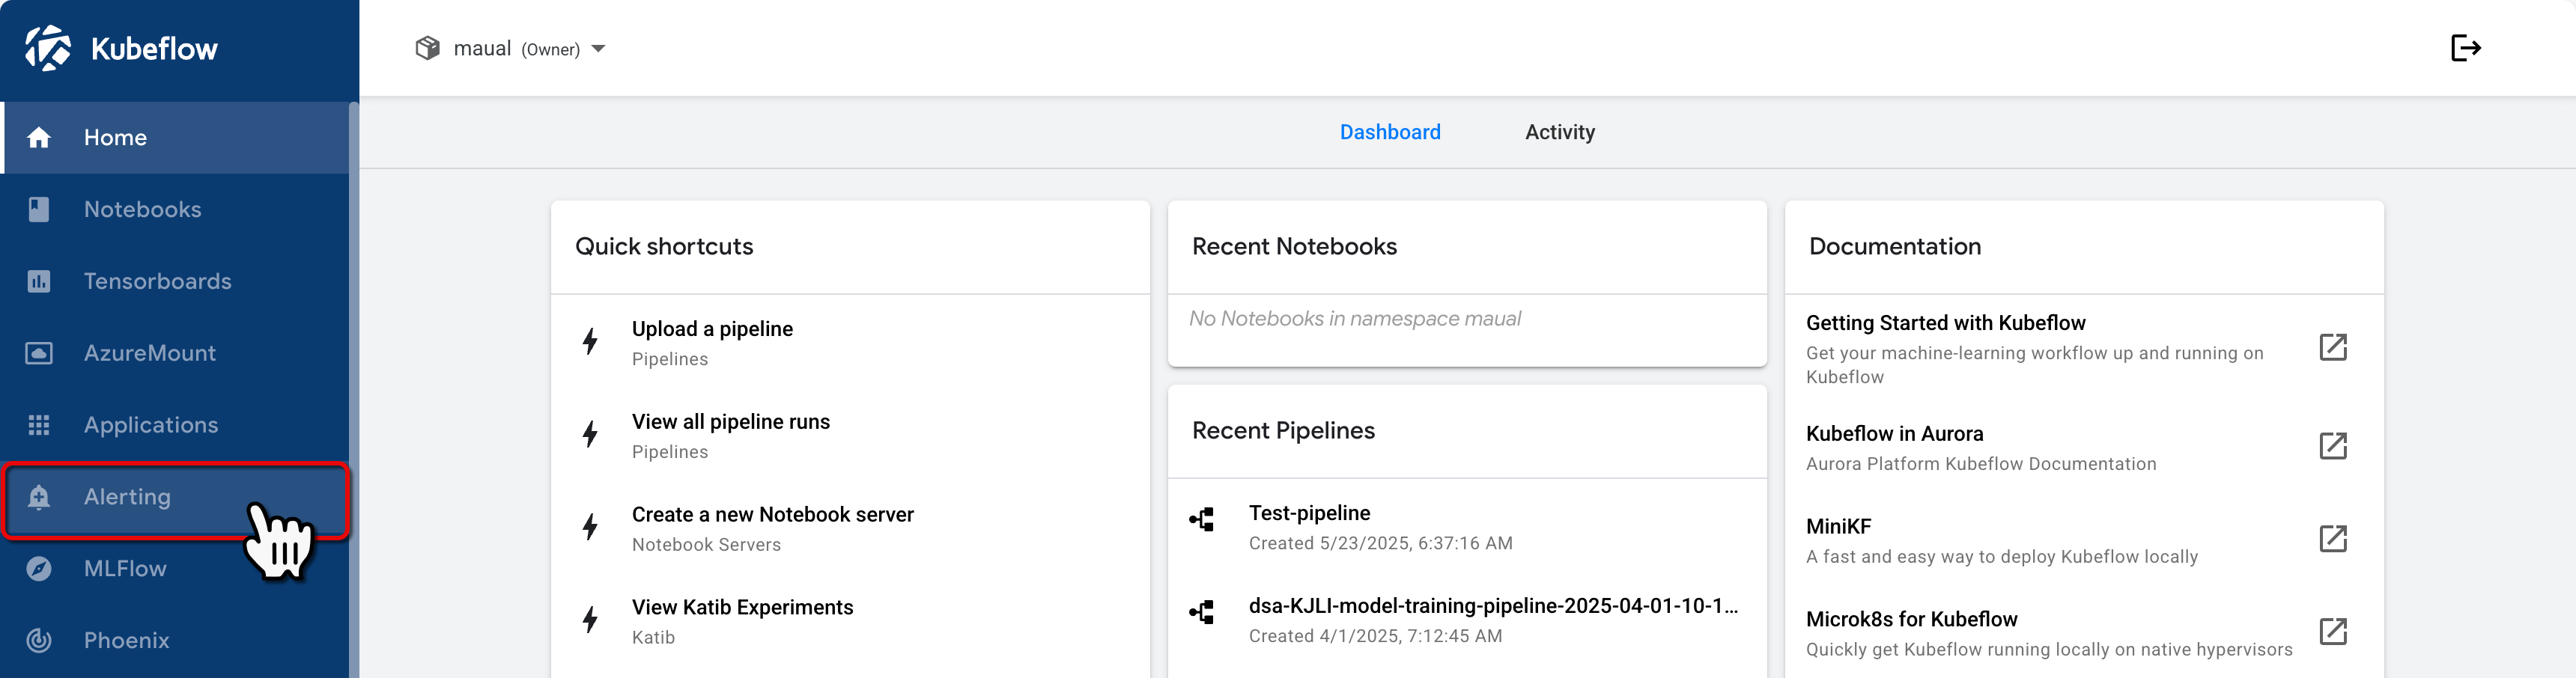 Kubeflow Central Dashboard
-
In the Alert Group Name field, enter a name for the alert group.
- Choose a meaningful name for your alert group, such as
PodStatusAlertsorResourceMonitoring.
- Choose a meaningful name for your alert group, such as
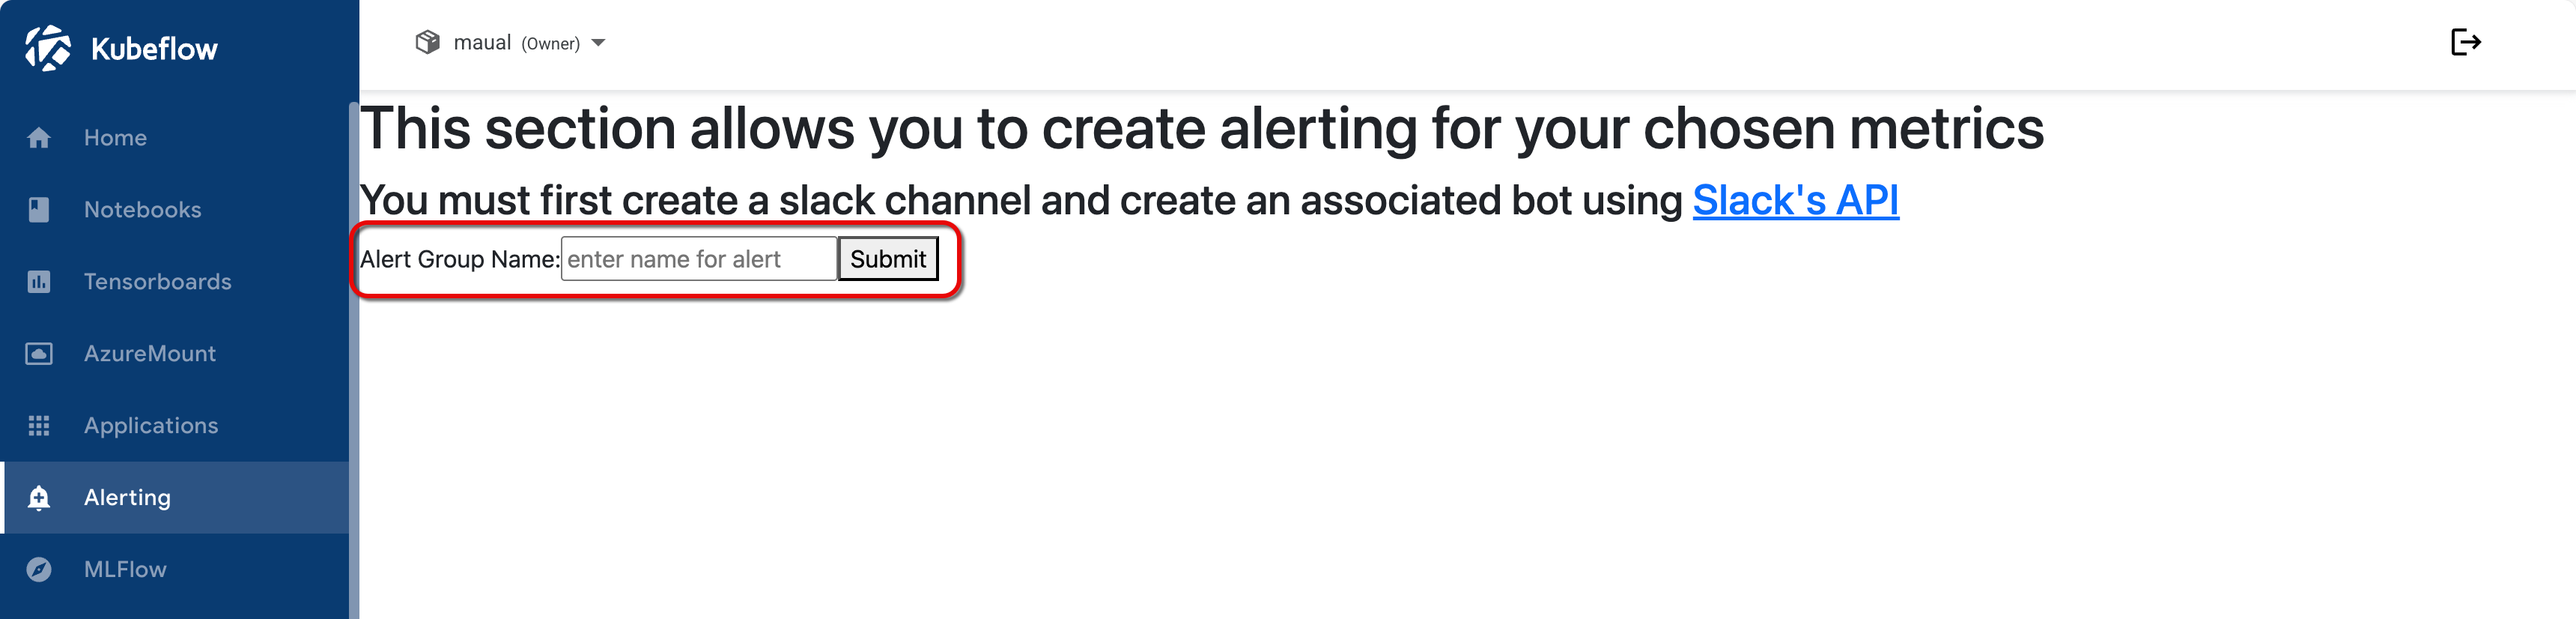 Alerting group initiation
-
Click Submit.
- The next step explains the dropdown menu for adding a webhook that appears after submitting.
Step 3: Add Slack webhook to Kubeflow
-
From the Alerting section, select a webhook.
- If you have already created a Slack webhook, it should appear in the Slack Webhook dropdown menu.
- Otherwise, select Other and enter your webhook manually.
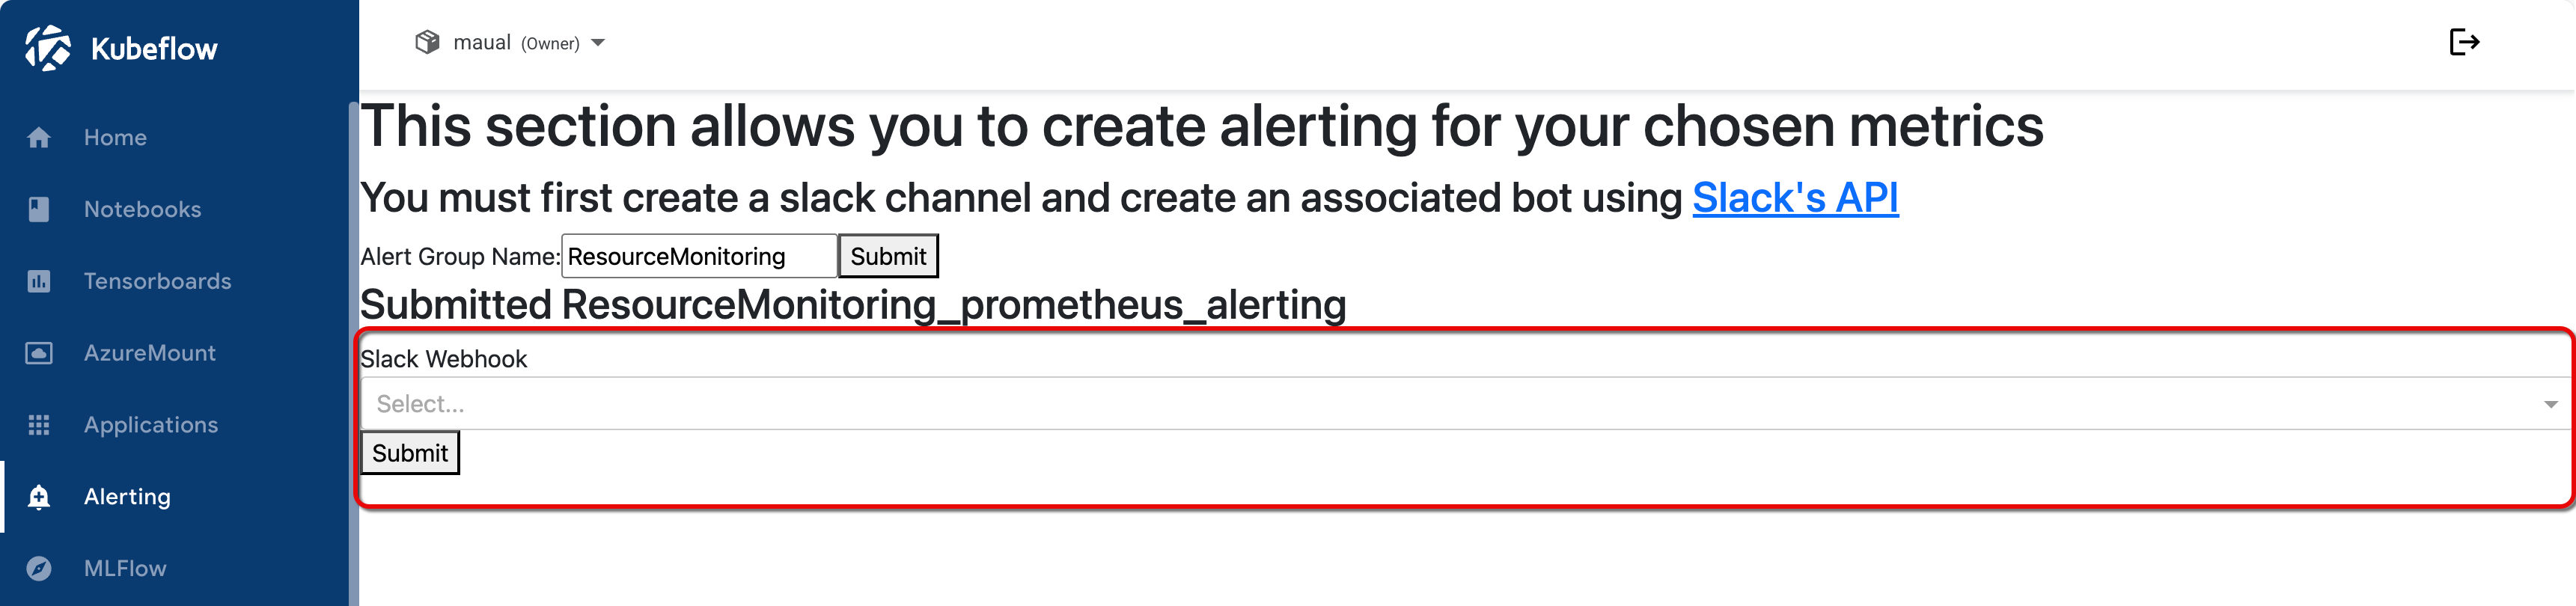 Select Slack webhook menu
-
Optional. If you selected Other, manually enter the Slack webhook and channel Name.
- Slack Webhook: Paste the webhook URL created for the Slack app. For example,
https://hooks.slack.com/services/T00000000/B00000000/XXXXXXXXXXXXXXXXXXXXXXXX - Channel Name: Enter the name of your Slack channel, starting with a
#. (e.g.,#myteam-kubeflow-alerts).
- Slack Webhook: Paste the webhook URL created for the Slack app. For example,
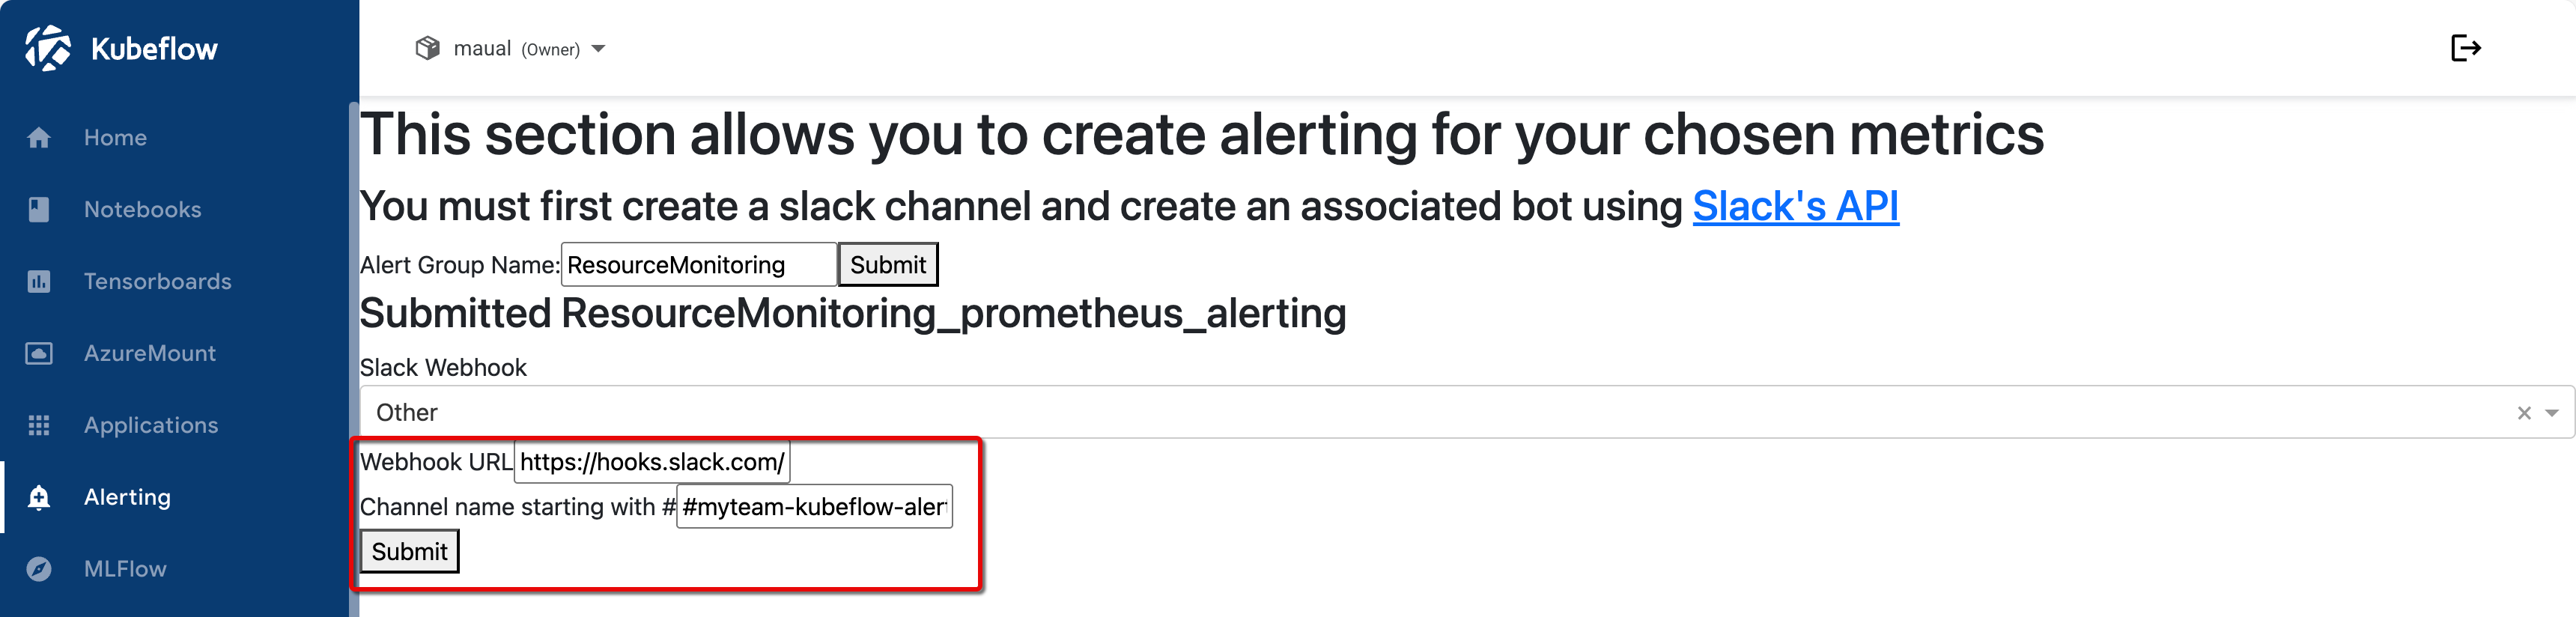 Manual entry of webhook data
- Click Submit.
Step 4: Add alerts
In this step, you have to add an alert. An alert is defined with specific metrics and parameters to monitor.
Follow these steps to add an alert to your alert group.
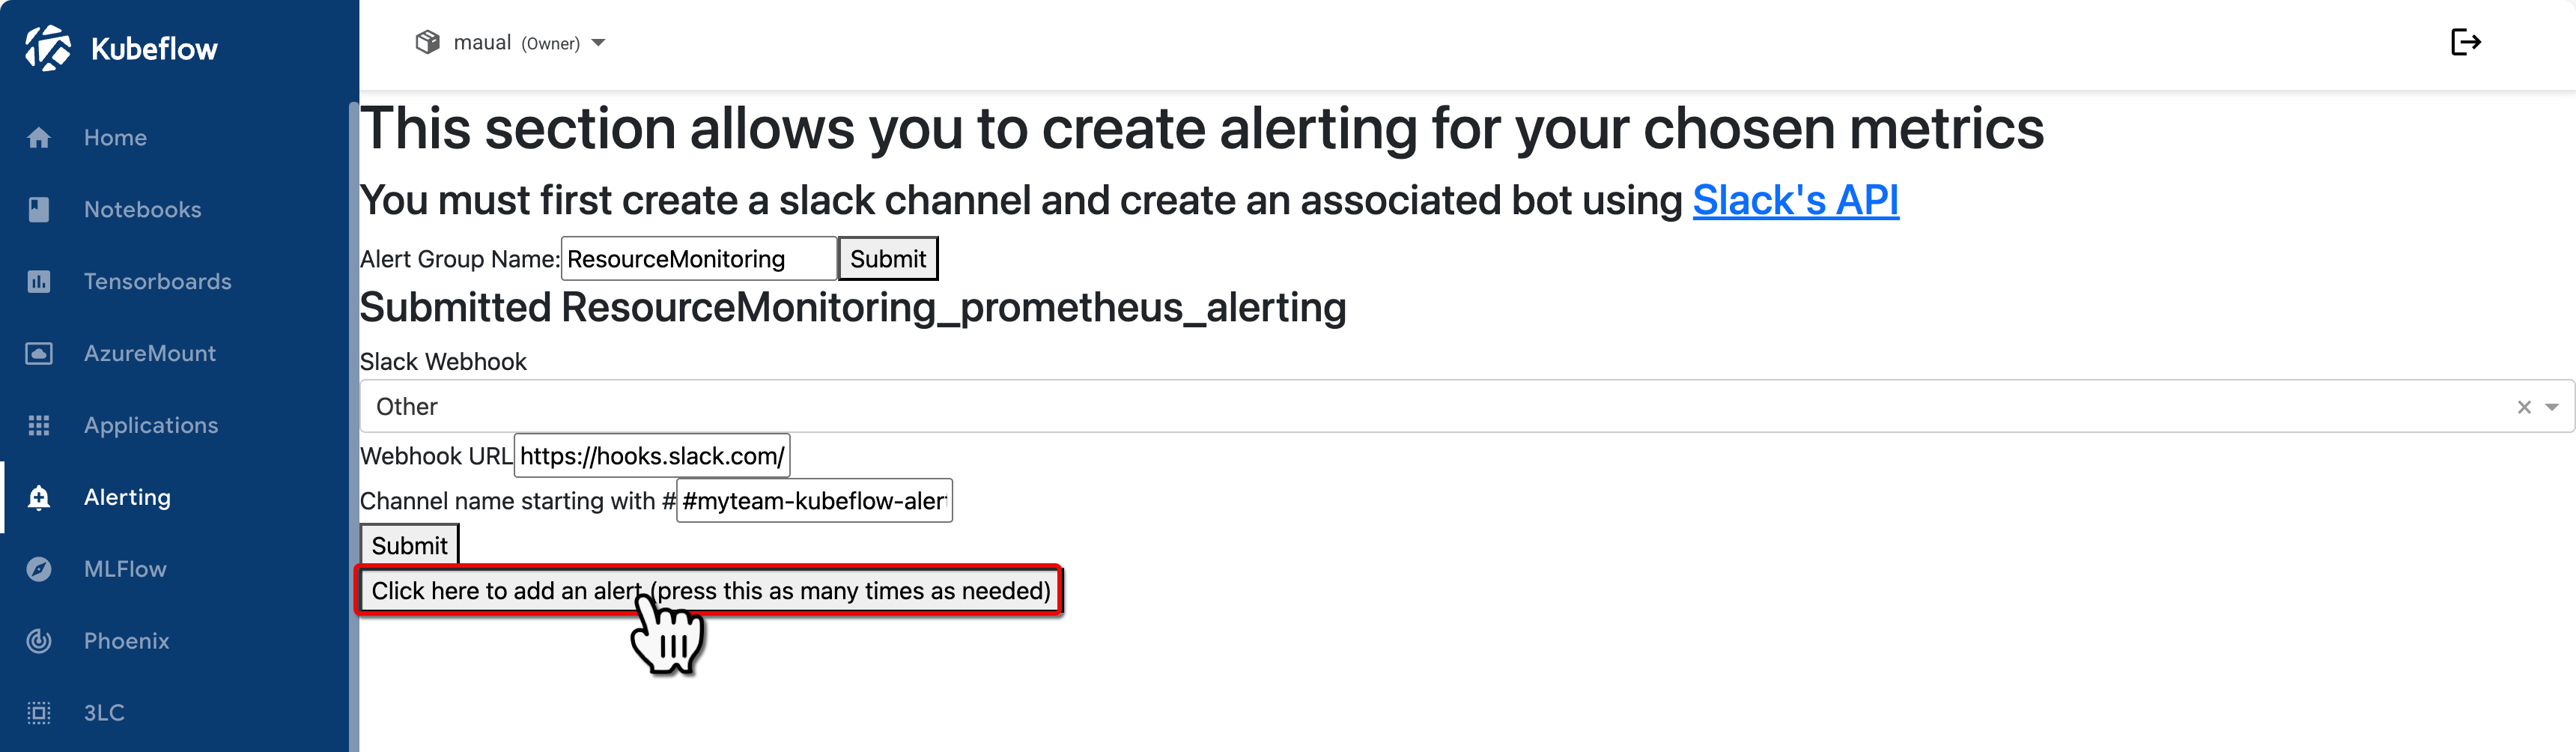
-
Click the long button titled: Click here to add an alert...
- Click the button for each alert you wish to add to the group.
- A list of settings appears for each alert you wish to add to the group.
- In the following steps, we will explain each settings field.
 Add alert to alert group
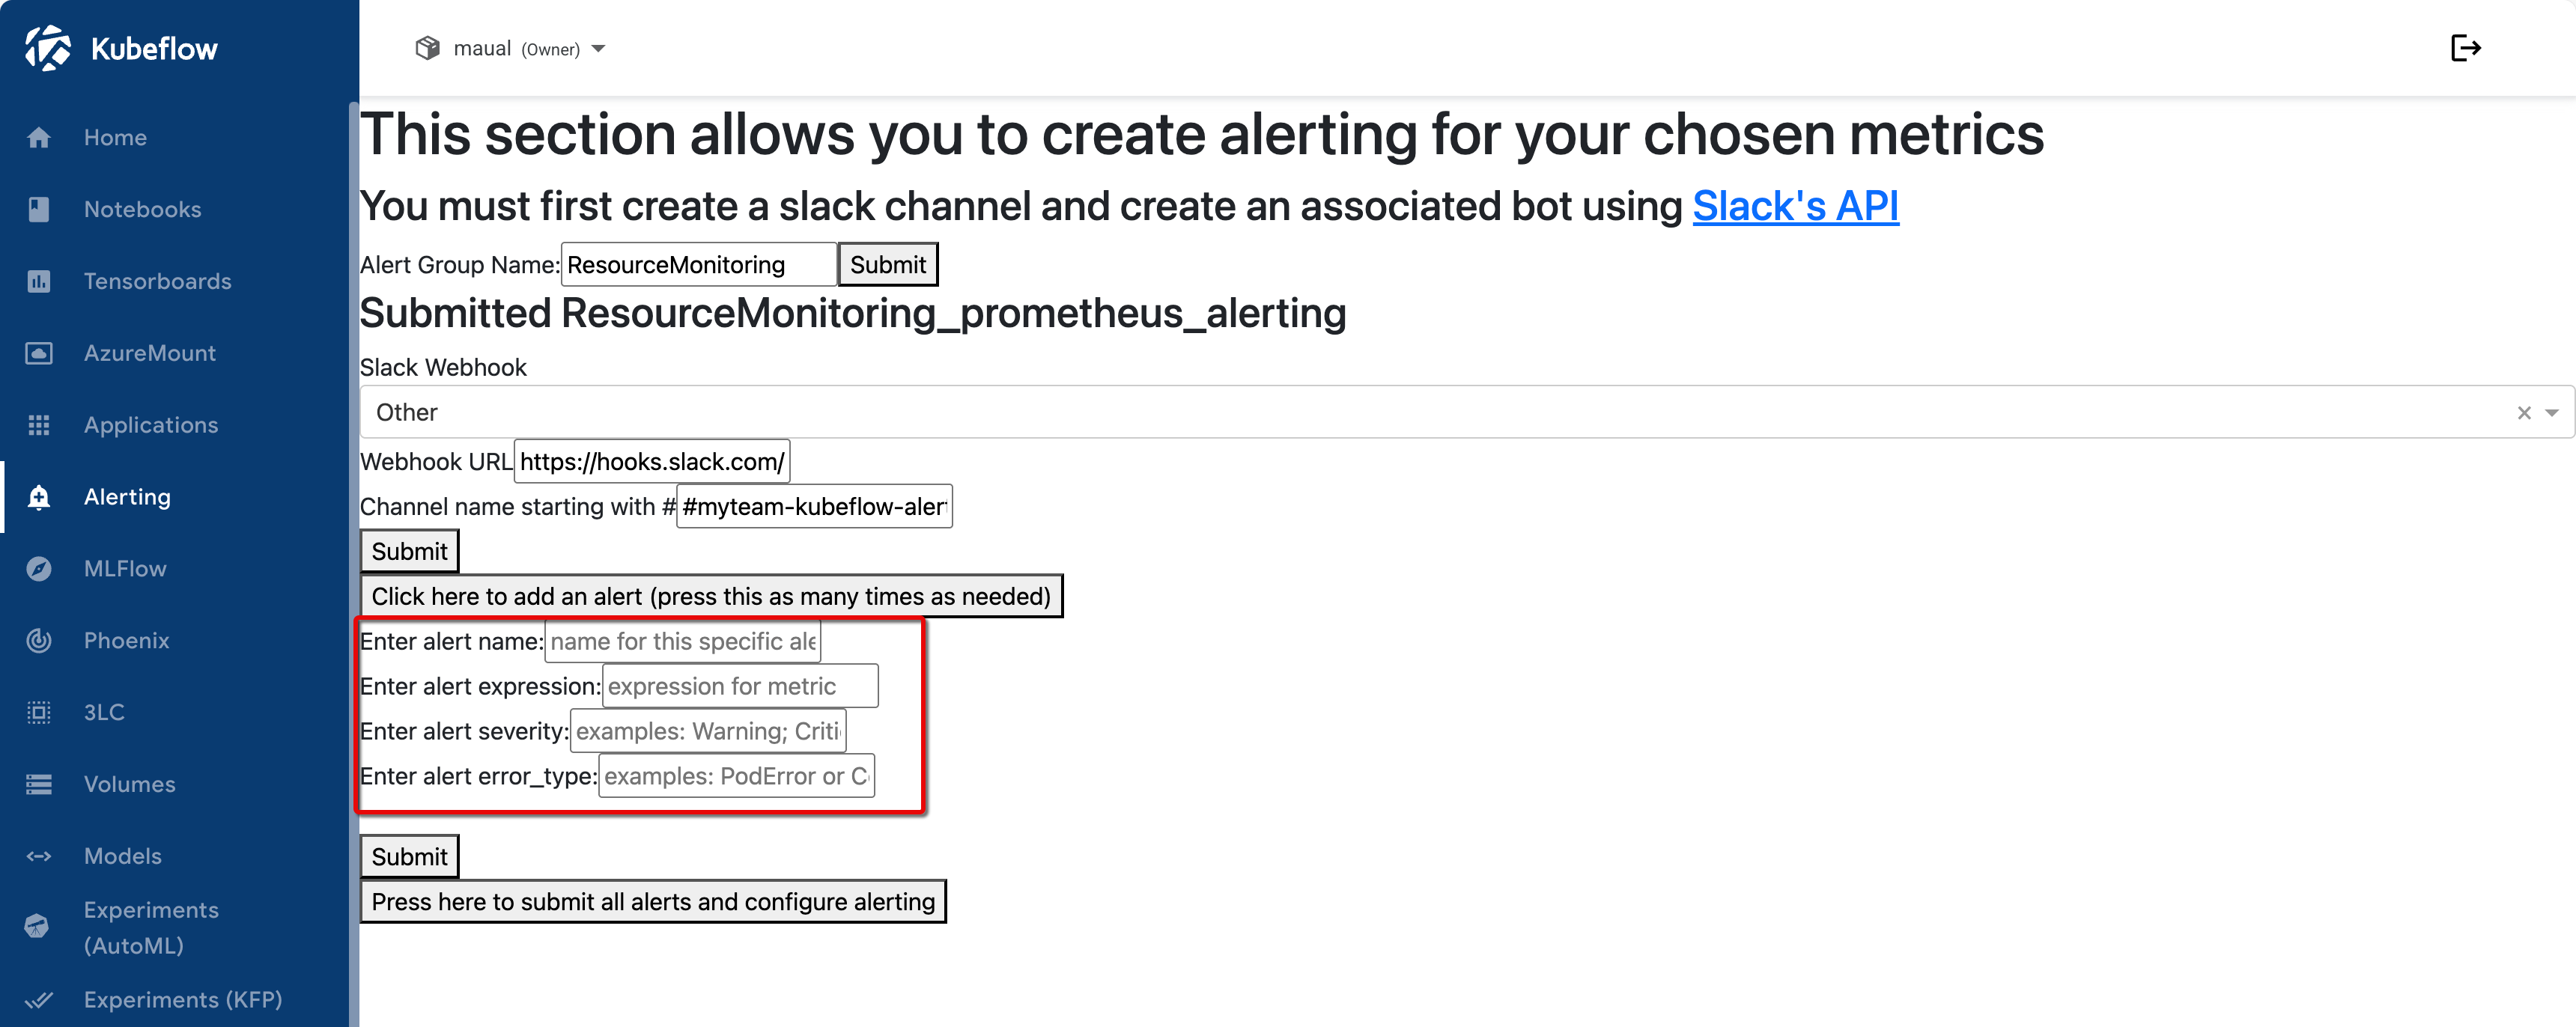 Alert settings
-
Fill out the Enter alert name field.
- Use a descriptive name for the alert to indicate its purpose.
- Example:
HighCPUUsageAlert.
-
Fill out the Enter alert expression field.
-
The alert expression is a Prometheus expression that defines the metric condition.
-
For example, to monitor CPU usage, you could use this PromQL query below. This expression triggers an alert when CPU usage exceeds 70% of the request.
avg(
  rate(container_cpu_usage_seconds_total{
    namespace=~"<your_namespace>",
    container=~"<your_container>"
  }[10m])
) by (namespace, container)
>
0.7 *
avg(
  kube_pod_container_resource_requests{
    resource="cpu",
    unit="core",
    namespace=~"<your_namespace>",
    container=~"<your_container>"
  }
) by (namespace, container)
note- Use the Explore section in the Grafana Dashboard to get familiarised with metrics.
- If you don't have access to Grafana or to Grafana's Explore section, contact the AI Platform team.
-
-
Fill out Enter alert severity field.
- Enter a value based on the urgency and importance of the alert.
- Some suggestions include:
Warning: Indicates a non-critical issue that requires attention.Critical: Indicates a critical issue that needs immediate action.
-
Fill out the Enter alert error type field.
- Specify the type of error you want the alert to monitor.
- Some suggestions include:
PodError: Indicates an error at the pod level.ContainerWarning: Indicates a warning at the container level.
-
Click Submit to create the alert.
- After submitting, the alert is active and will notify your Slack channel if the specified conditions are met.
-
Optional. Repeat the process for each alert you wish to add to the alert group.
- To submit all alerts at once, instead of one-by-one, click the long buttoned labeled Press here to submit all alerts and configure alerting.
Summary
Here is a summary of the example configuration set up in this tutorial. This example is set up to monitor CPU usage across pods.
- Alert Group Name: PodStatusAlerts
- Slack Webhook: https://hooks.slack.com/services/T00000000/B00000000/XXXXXXXXXXXXXXXXXXXXXXXX
- Channel Name: #myteam-kubeflow-alerts
- Alert:
    - Alert Name: HighCPUUsageAlert
    - Alert Expression: avg(rate(container_cpu_usage_seconds_total{namespace=~"\<your_namespace\>", container=~"\<your_container\>"}[10m])) by (namespace, container) > 0.7* avg(kube_pod_container_resource_requests{resource="cpu", unit="core", namespace=~"\<your_namespace\>", container=~"\<your_container\>"}) by (namespace, container)
    - Alert Severity: Critical
    - Alert Error Type: PodError
This alert setup will send a message to the #myteam-kubeflow-alerts Slack channel if CPU usage in any pod exceeds 70%.
With this configuration, the Kubeflow alerting plugin is ready to send notifications based on your specified conditions. Customize the alert expression, severity, and error type to monitor other metrics as needed.